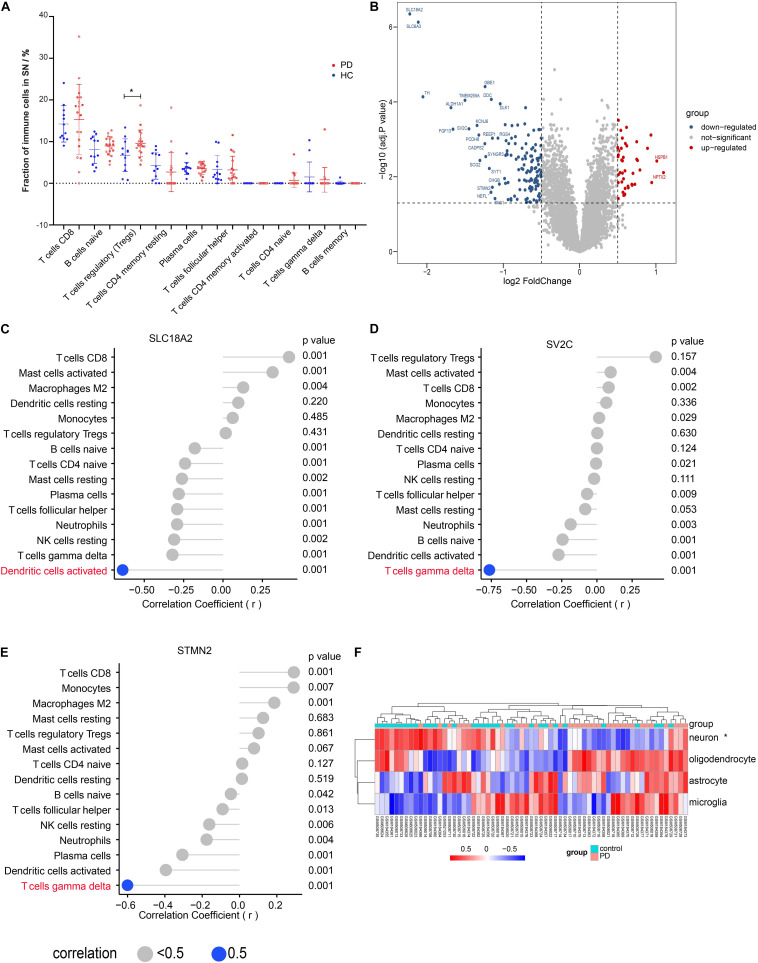
FIGURE 2.
Tregs fraction in substantia nigra (SN) was significantly different between PD and HC. (A) The main immune cell fractions in the SN from PD and HC. The ordinate represents the immune cell fractions, and the abscissa represents the immune cell types. The blue dots represent HC samples, and the red dots represent PD samples. (B) Volcano plot of the differential gene analysis of SN. (C) Correlation between SLC18A2 and immune cells. (D) Correlation between SV2C and immune cells. (E) Correlation between STMN2 and immune cells. (F) The heat map of the enrichment score through the GSVA analysis. *p < 0.05.

