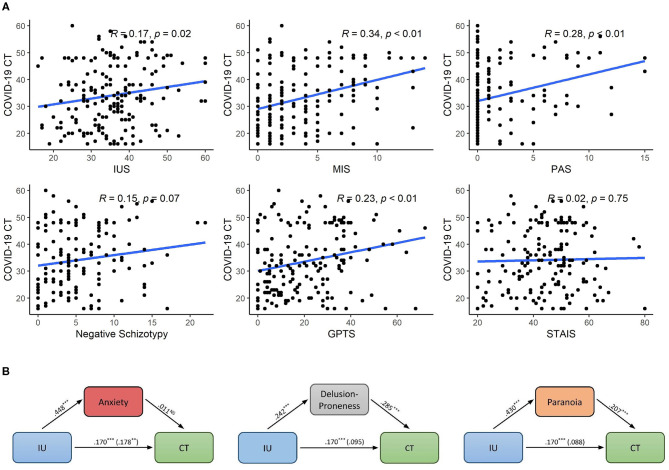
Figure 2.
(A) Relationships of individual difference measures with CT in Study 2. Correlation coefficients for PAS and Negative schizotypy represent Spearman's Rho while all others represent Pearson's R. (B) Mediation paths for three possible factors explaining the relationship between IU and CT. CT, Conspiratorial thinking; IUS, Intolerance of Uncertainty Scale; MIS, Magical Ideation Scale; PAS, Perceptual Aberration Scale; GPTS, Green et al. Paranoid Thought Scale. **p < 0.01, ***p < 0.001.

