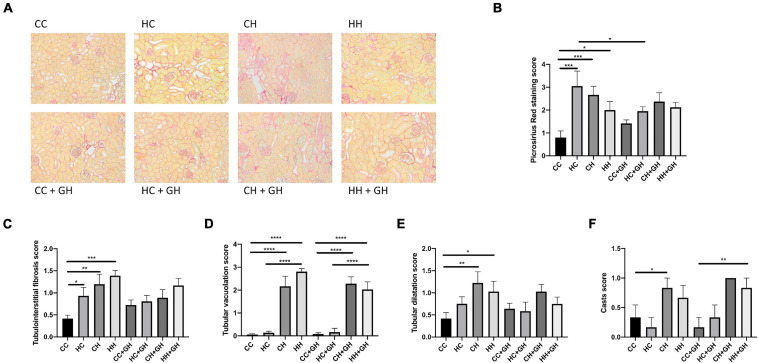
FIGURE 5.
Renal structural changes. (A) Representative images of picrosirius red staining at 200× magnification, (B) quantitation of picrosirius red staining, (C) tubulointerstitial fibrosis, (D) tubular vacuolation, (E) tubular dilatation, (F) casts. Results expressed as mean ± SEM, n = 6 *p < 0.05, **p < 0.01, ***p < 0.001, ****p < 0.0001. CC, control offspring; HC, lean offspring of obese mothers; CH, obese offspring of lean mothers; HH, obese offspring of obese mothers; CC + GH, control offspring exposed to gestational hydralazine; HC + GH, lean offspring of obese mothers with gestational hydralazine; CH + GH, obese offspring of lean mothers with gestational hydralazine; HH + GH, obese offspring of obese mothers with gestational hydralazine.

