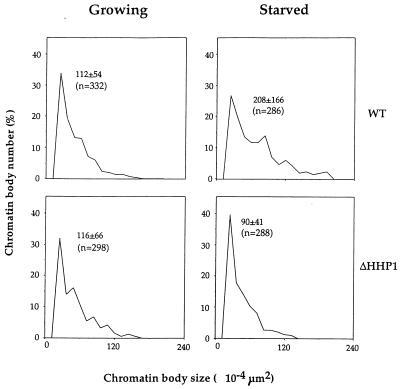
FIG. 6.
Distribution of chromatin body size in growing and starved cells. The size of chromatin bodies from growing and starved wild-type (WT) or ΔHHP1 cells was measured. The mean ± the standard error and the number of measurements (indicated as “n”) are shown in each graph. Note that the size distributions of chromatin bodies from growing wild-type cells (upper left panel) and growing ΔHHP1 cells (lower left panel) are comparable. In contrast, chromatin bodies from starved wild-type cells (upper right) are significantly larger than those from starved ΔHHP1 cells (lower right).

