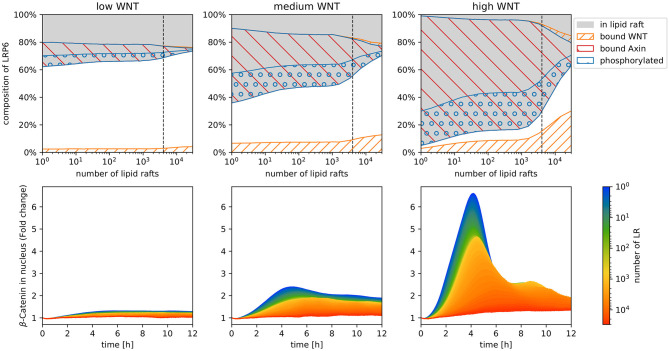
Figure 3.
Simulation results of the model displayed in Figure 2, with increasing raft numbers and with three different WNT stimuli: high, medium, and low. In the upper row the composition of LRP6 states after 12 h of stimulation is depicted for each WNT stimulation scheme. Depicted are raft-associated (gray), phosphorylated (blue circles), WNT-bound (orange stripes), and Axin-bound (red stripes) LRP6 molecules. Note that in the stacked area chart of the upper row, the amount of bound and phosphorylated LRP6 are displayed separately for non-raft (lower area, white background) and raft (upper area, gray background) domains and have to be added/summed up to obtain the total number of each receptor state. The lower row illustrates the fold change of β-catenin concentration in the nucleus [compared to the initial number of β-catenin in the nucleus (nbetanuc)] during 12 h of constant WNT stimulation for increasing numbers of lipid rafts. Each colored line represents the mean trajectory of several simulation runs (replications) of our model parameterized with the corresponding lipid rafts amount (encoded in the color).

