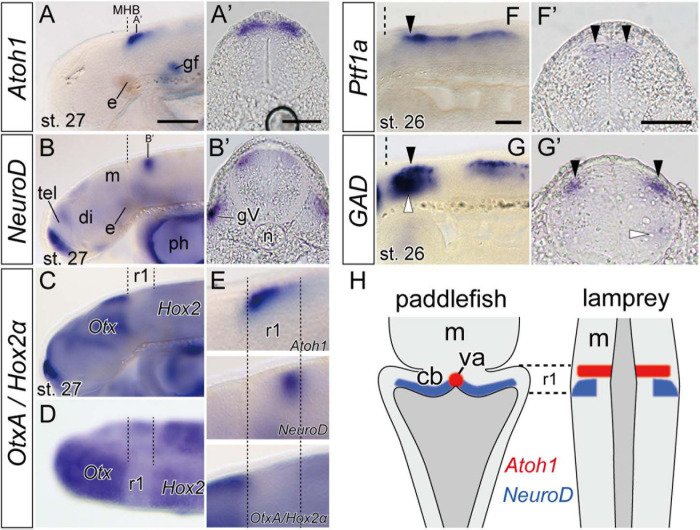
FIGURE 3.
Expression of genes involved in neuron differentiation during lamprey late embryonic stages. (A,A’) Atoh1 expression is restricted to the anterior r1 in stage 27 embryo (arrow heads). Dashed lines indicate the MHB. (B,B’) NeuroD expression is observed behind the Atoh1 expression domain (arrowheads). Note that (A’,B’) are not at the same rostrocaudal positions in r1. The apparent asymmetrical staining in (B’) does not reflect the actual difference in expression, but is caused by the slightly oblique cutting of the sections. (C,D) In situ hybridization of both OtxA and Hox2α probes in stage 27 in lateral view (C) and dorsal view (D). OtxA is expressed only anterior to the midbrain, whereas Hox2α is expressed caudally from r2. Dashed lines indicate the borders of r1 identified as “Otx–Hox free” domain. (E) High magnifications of the panel (A–C) in r1 region. (F,F’) Ptf1a-B expression at the ventricular zone at stage 26 (arrowheads). (G,G’) GAD is expressed in the hindbrain at the same dorsal level than –but lateral to– the Ptf1a expression domains (black arrowheads) and also in a ventral domain (white arrowheads). (H) Comparison of Atoh1 and NeuroD expression patterns in the hindbrain between paddlefish, Polyodon spathula (stage 42, based on Butts et al., 2014c), and lamprey. Note that although the lamprey hindbrain does not show a ‘diamond shape’ of the rhombic lip during embryonic stages, the topological relationship of these gene expression patterns is comparable in both species. cb, cerebellum primordium; gV, trigeminal ganglion; ph, pharynx; va, valvula cerebelli. See Figures 1,2 for other abbreviations. Scale bars, 100 μm (A–D), 50 μm (A’,B’,F,F’,G,G’).

