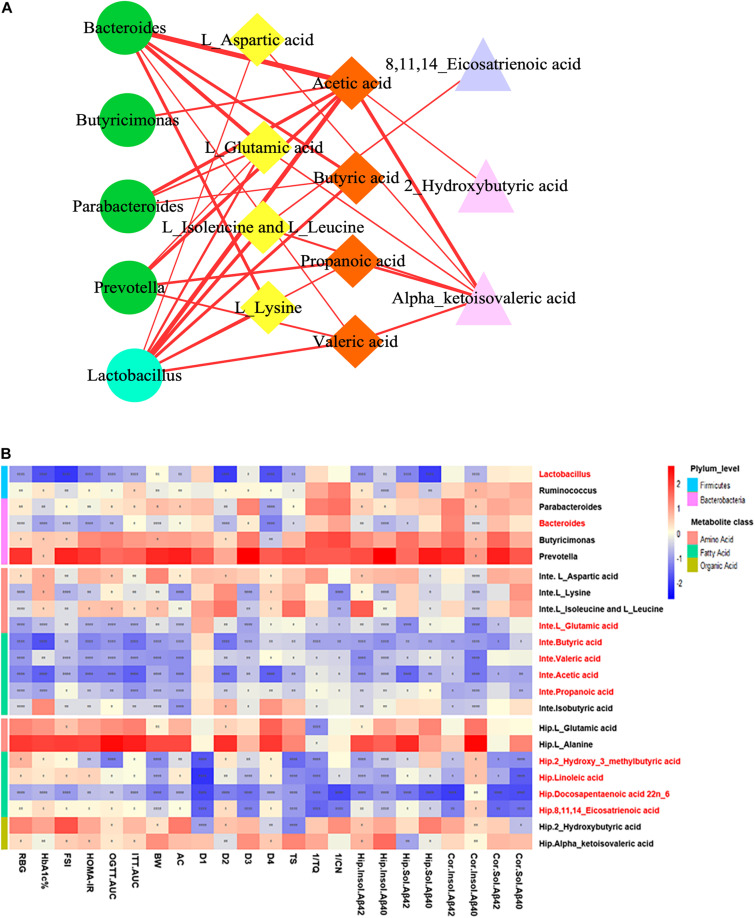
FIGURE 8.
Correlation analysis integrating bacterial genera, intestinal metabolites, hippocampus metabolites, and DACD phenotypes. (A) Network diagram showing the correlation among bacterial genera (green circle denotes Bacteroidetes; cyan circle indicates Firmicutes), intestinal metabolites (yellow rhombus denotes aliphatic amino acids; orange rhombus indicates short chain fatty acids), and hippocampus metabolites (purple triangle denotes unsaturated fatty acids; pink triangle indicates aliphatic organic acids). (B) Heatmap showing the correlation between potential biomarkers and DACD phenotype. The degree of correlation is shown by the gradient change of red (positive correlation) and blue (negative correlation). *p < 0.05, **p < 0.01, ***p < 0.001, ****p < 0.0001. RBG, random blood glucose; HbA1c%, glycosylated hemoglobin; FSI, fasting serum insulin; HOMA-IR, homeostasis model of assessment for insulin resistance; OGTT-AUC, area under the curve of the oral glucose tolerance test; ITT-AUC, area under the curve of the insulin secretion test; BW, body weight; AC, abdominal circumference; D1–D4, escape latency during a 4-day training course in the orientation navigation test of Morris water maze test; TS, time in searching original platform location in the spatial exploration test of Morris water maze test; 1/TQ, the reciprocal of time spent in each quadrant (%) in the spatial exploration test of Morris water maze test; 1/CN, the reciprocal of crossing number of the original platform location in the spatial exploration test of Morris water maze test; Inte, intestine; Hip, hippocampus; Cor, cortex.

