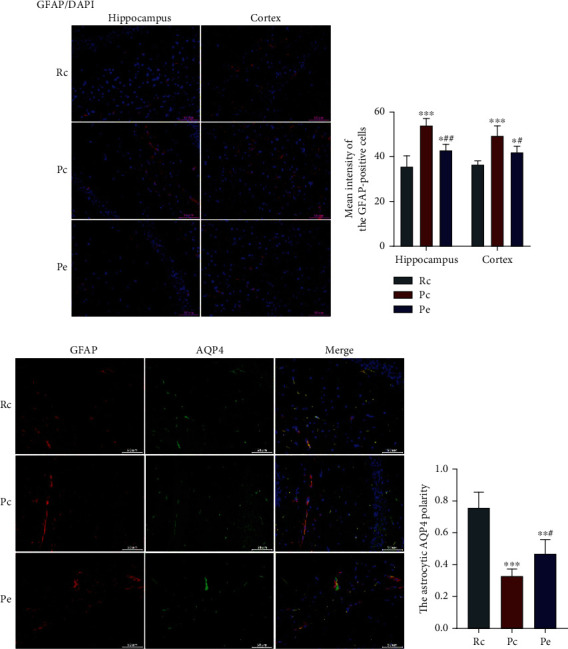
Figure 7.

EA inhibited the reactivity of astrocytes and improved AQP4 polarity. (a) GFAP-positive cells were spread in each group, scale bars = 50 μm. (b) The mean fluorescence intensity of GFAP-positive cells in the hippocampus and cortex. (c) Immunofluorescence: double-labeling of GFAP and AQP4, scale bars = 50 μm. (d) Astrocytic AQP4 polarity. Data are expressed as the mean ± SD (n = 4 in each group). ∗P < 0.05, ∗∗P < 0.01, and ∗∗∗P < 0.001 versus the Rc group; #P < 0.05 and ##P < 0.01 versus the Pc group.
