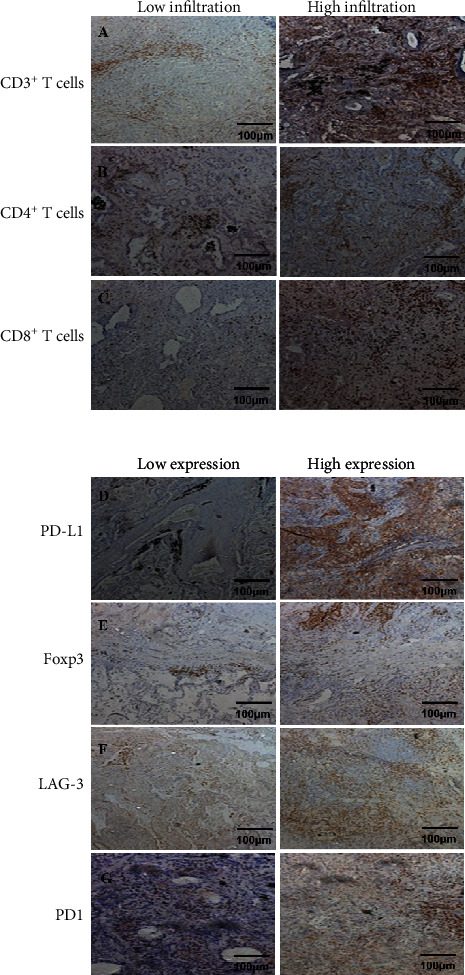
Figure 1.

Schematic diagram of immunohistochemical staining of markers. (a) CD3+ T cell staining; (a), 1: low infiltration of CD3+ T cells; (a), 2: high infiltration of CD3+ T cells; (b) CD4+ T cell staining; (b), 1: low infiltration of CD4+ T cells; (b), 2: high infiltration of CD4+ T cells; (c) CD8+ T cell staining; (c), 1: low infiltration of CD8+ T cells; (c), 2: high infiltration of CD8+ T cells; (d) PD-L1 staining; (d), 1: low expression of PD-L1; (d), 2: high expression of PD-L1; (e) Foxp3 staining; (e), 1: low expression of Foxp3; (e), 2: high expression of Foxp3; (f) LAG-3 staining; (f), 1: low expression of LAG-3; (f), 2: high expression of LAG-3; (g) PD1 staining; (g), 1: low expression of PD1; (g), 2: high expression of PD1.
