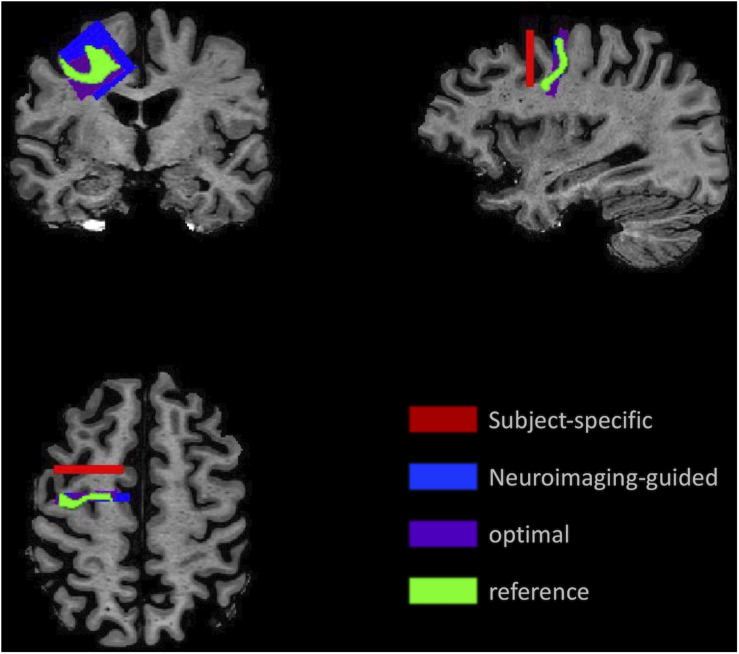
FIGURE 3.
Illustration of the sampling framework supporting assessment of precision and accuracy. Position of the samples demonstrates the variation in location and angle of the MFG ROI for the subject-specific samples (red) generated using traditional neuropathologic sampling and the reference sample (light green) which indicated the intended target. Using the reference sample to guide slice sampling results in the neuroimaging-guided sample (blue), which shows marked improvement in overlap with the reference sample. The highest overlap that could be achieved with slicing at any angle or coronal position is the optimal sample (purple).

