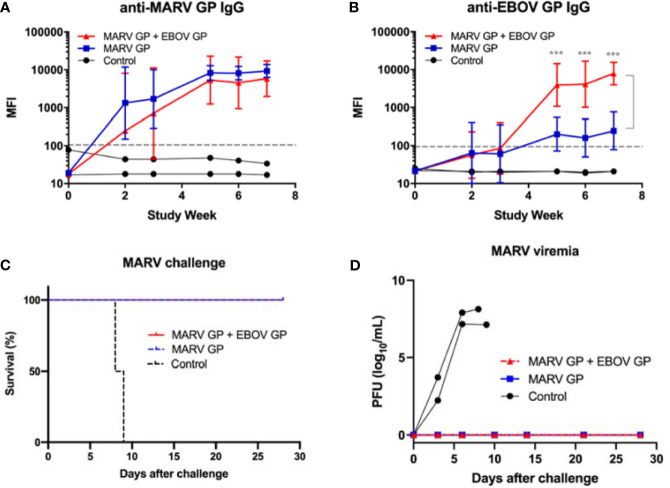
Figure 6.
Immune response to MARV vaccination, survival and viremia after MARV challenge. MIA performed in triplicate for animals vaccinated at three-week intervals with three doses of MARV GP with adjuvant (n=4) or MARV GP + EBOV GP with adjuvant (n=4). Controls received adjuvant only (n=2): (A) MARV GP-binding IgG and (B) EBOV GP-binding IgG. Each data point for vaccinated groups represents geometric mean ± 95% confidence interval whereas data points for controls were plotted per individual animal. The dashed grey line marks the threshold for positive detection of antigen-specific IgG at 3 SD above mean MFI of negative control samples. (C) Kaplan-Meier survival curves after challenge with MARV. (D) MARV viremia as assessed by plaque assay. Each data point for vaccinated groups represents mean ± SEM. Data points for controls were plotted per individual animal. ***p < 0.001.

