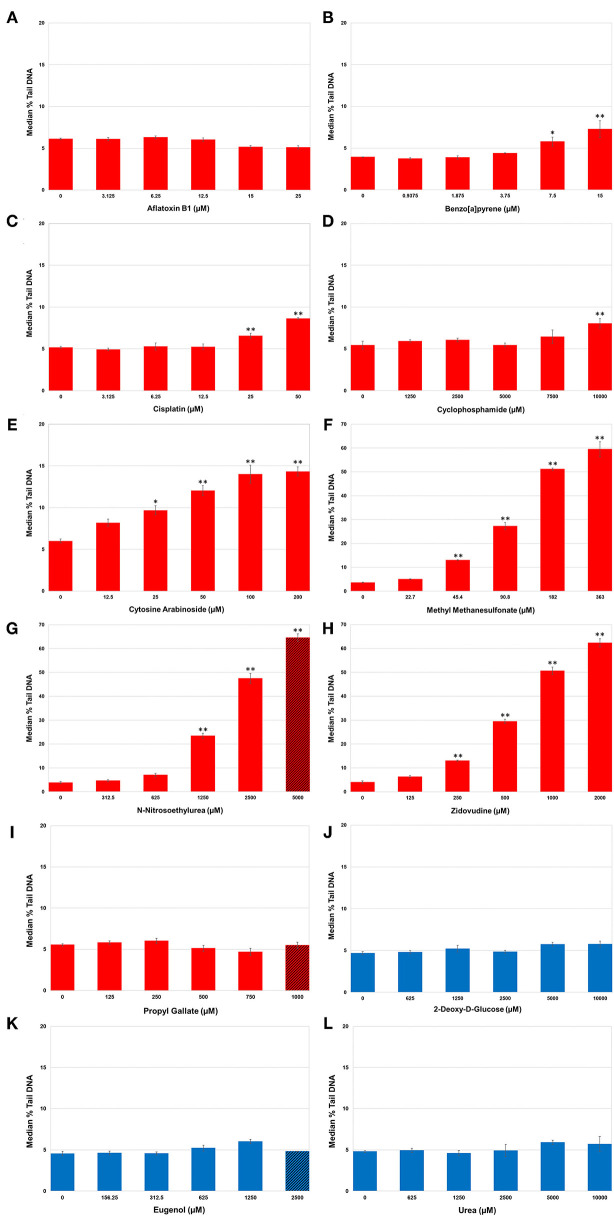
Figure 2.
DNA damage in human HepaRG™ cells measured using the alkaline CometChip® assay. Cells were exposed to increasing concentrations of DNA damage-inducing (DDI; A–I) and non-DDI test chemicals (J–L). Median % tail DNA is shown 4 h following the last exposure. The data are expressed as the median % tail DNA ± SE (n = 4). Red bars represent Group 1 DDI chemicals, blue bars denote the Group 2 non-DDI chemical and the Group 3 potentially misleading positive chemicals. Diagonal lines indicate overtly cytotoxic concentrations. Note the difference in the scale of the y-axis for MMS, ENU, and ZDV due to the large magnitude of the response for these three DDI (Group 1) chemicals. *P < 0.05, **P < 0.001 compared to matched vehicle control.

