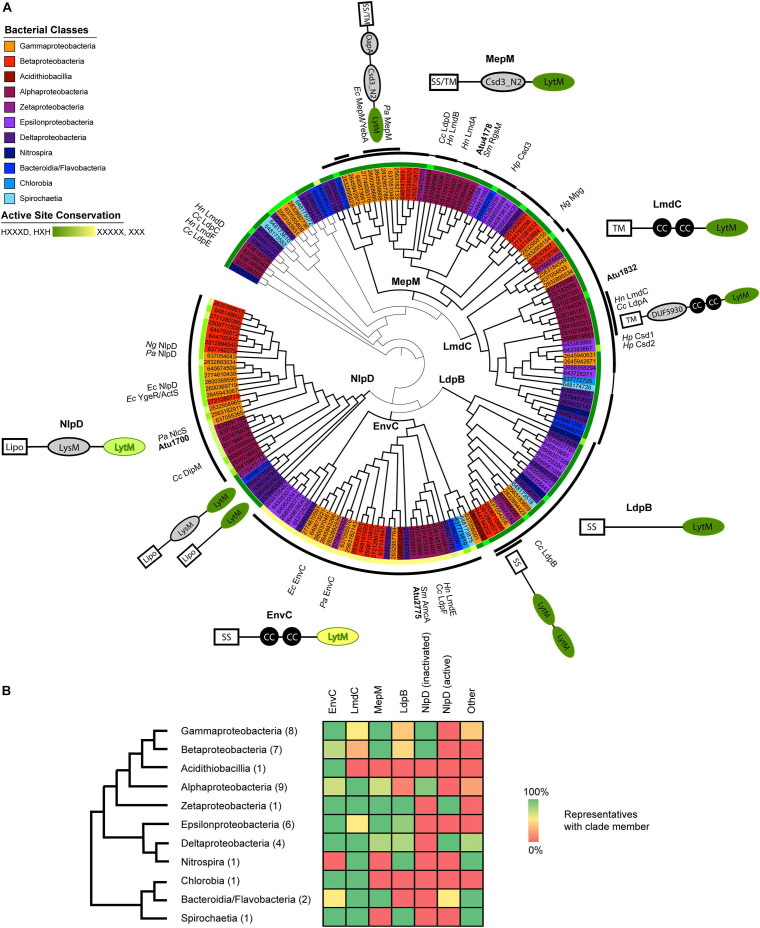
FIGURE 1.
Proteobacterial LytM domain-containing proteins segregate phylogenetically into five major classes with identifiable features outside of the LytM domain. (A) Maximum likelihood gene tree of LytM factors constructed with aligned LytM domains from 41 representative species from the Proteobacteria and deep-branching Proteobacteria. The five clades are labeled at their branch point and emphasized by thicker branch weights. This tree has been arbitrarily rooted to clarify the structure of the five clades (see also Supplementary Figure 1). The taxa are colored according to bacterial class (see legend) and shown as JGI ID numbers, which are associated with genetic loci and genomes in Supplementary Table 1. Taxa that have been studied and named are labeled in the outermost ring (Cc, Caulobacter crescentus; Ec, Escherichia coli; Hn, Hyphomonas neptunium; Hp, Helicobacter pylori; Ng, Neisseria gonorrhoeae; Pa, Pseudomonas aeruginosa; Sm, Sinorhizobium meliloti). The first ring outside of the taxa indicates the degree to which the active site motif (HXXXD, HXH) is conserved, with dark green indicating full conservation and yellow indicating loss of all conservation. See also Supplementary Figure 3 for LytM consensus sequences for each clade. The thick black arcs identify which members of the clade include the schematized N-terminal domains and help distinguish where clades begin and end. Some MepM and LmdC members did not have clade-associated domains, which is indicated by a thinner connecting line within the arc. Some groups of LytM factors shared additional features and these are indicated by a second arc layer. Schematics of characteristic clade architectures appear horizontally next to the clades. LytM domains are colored according to active site conservation. N-terminal domains are colored in gray: LysM, PG-binding domain; CC, coiled-coil motif; DUF5930; Csd3_N2, autoinhibition domain identified in Csd3 of H. pylori; OapA, PG-binding domain identified in OapA of H. influenzae. Subclade architectures appear at an angle close to the arc of the sequences they represent. Some genes have more copies than the indicated number of N-terminal domains; for signal sequences or domains identified for each LytM factor gene, see Supplementary Table 1. For branch lengths and bootstrap values, see Supplementary Figure 2. (B) Presence/absence of LytM clade members in each bacterial class. Bacterial classes are arranged in a cladogram drawn using phylogenies constructed from concatenated gene trees (Wu et al., 2009; Kysela et al., 2016). The number of representatives of each class is shown in parentheses. Presence/absence is indicated in the heat map using a gradient of green (100%) to yellow (50%) to red (0%). Only the genes in the tree in (A) are included. See Supplementary Table 2 for presence/absence data for each species.

