FIGURE 3.
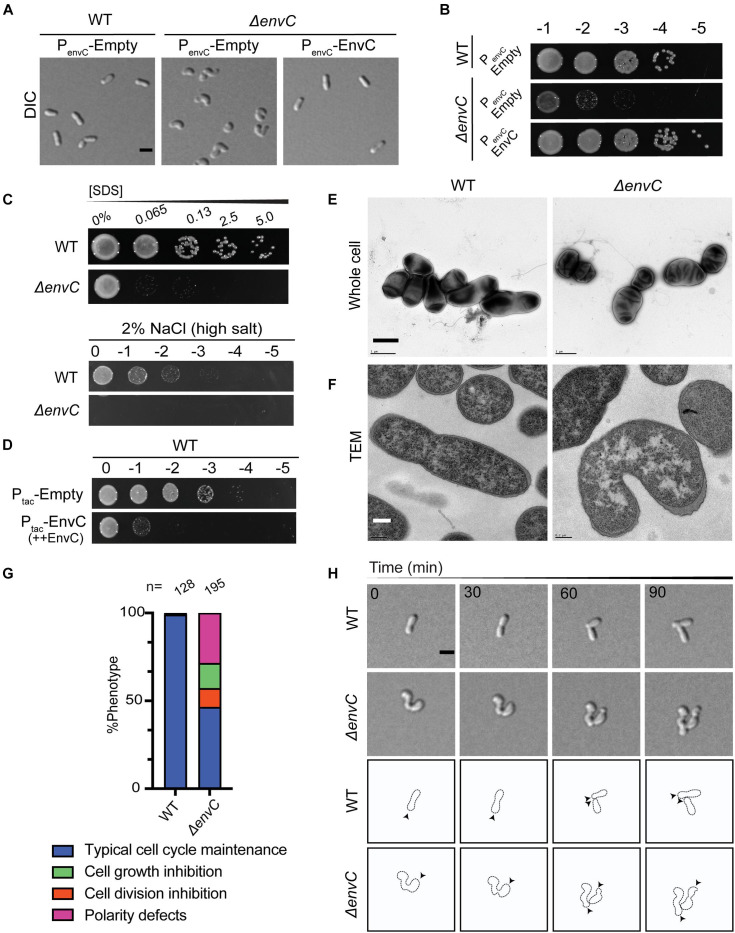
Loss of envC results in cell curvature, decreased viability, and OM destabilization in A. tumefaciens. (A) DIC images of exponentially growing WT cells containing empty plasmid (PenvC-Empty), ΔenvC containing empty plasmid (PenvC-Empty), or ΔenvC expressing envC via its native promoter [PenvC-EnvC (complementing plasmid)]. (B) Cell viability of WT cells expressing empty plasmid (PenvC-Empty), ΔenvC containing empty plasmid (PenvC-Empty), or ΔenvC expressing envC via its native promoter [PenvC-EnvC (complementing plasmid)] is shown by spotting serial dilutions. (C) SDS and salt sensitivity of WT and ΔenvC. Briefly, for the SDS assay, exponentially growing cells were treated with various concentrations of SDS for 5 min and spotted on LB plates and analyzed 24 h post incubation. To assess salt sensitivity, exponentially growing WT and ΔenvC were serially diluted and spotted on LB solid medium containing 2% NaCl (high salt) and analyzed ∼36 h post incubation. (D) Cell viability of WT strain after overexpression of empty plasmid (Ptac-Empty) or envC under the control of the tac promoter (Ptac–EnvC). (E) TEM of whole cells of WT (left) A. tumefaciens or the ΔenvC mutant (right). Cells were grown ∼16 h in LB to early stationary phase, fixed, and stained with 2% uranyl acetate. Scale bar = 1 μm. (F) Thin section TEM of WT (left) A. tumefaciens or the ΔenvC mutant (right). Cells from (E) were embedded in resin and prepared as described in the methods. Scale bar = 0.2 μm. (G) Quantitative analysis of the phenotypes of the WT and ΔenvC strains. % Phenotype was calculated by counting the number of cells in a WT and ΔenvC time-lapses displaying one of the phenotypes indicated and dividing it by the total number of cells per strain. (H, top) Time-lapse microscopy of WT and ΔenvC over the course of 90 min. Scale bar = 2 μm. (H, bottom) Schematic of WT and ΔenvC time-lapses. Arrows indicate active growth. All data collected for this figure was obtained from cells grown in LB.

