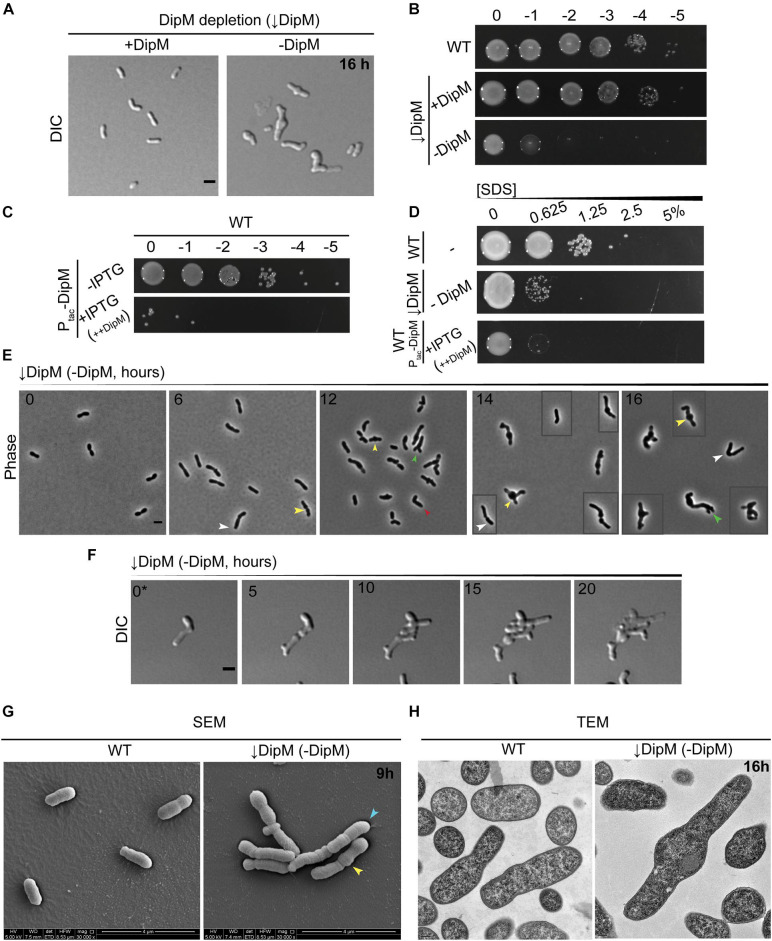
FIGURE 5.
dipM is essential in A. tumefaciens and depletion results in mid-cell bulging, inhibition of division, and ectopic pole formation. (A) DIC imaging of DipM replete (↓DipM, +DipM; grown in the presence of IPTG) and depleted cells (↓DipM, –DipM) for 16 h. Depletion of DipM (↓DipM, –DipM) was achieved by washing the cells three times in LB and resuspending the culture (OD600 ∼ 0.1) in LB –IPTG. DipM depletion in LB results in mid-cell bulges and cell lysis. Scale bar = 2 μm. (B) Spot viability assays of WT, DipM replete (↓DipM, +DipM) and DipM depleted ((DipM, −DipM). Depletion of DipM (↓DipM, –DipM) was achieved by washing the cells three times in LB before spotting on LB plates. (C) Spot viability assays of WT cells containing a plasmid encoded DipM under the control of the Ptac promoter in the absence (–IPTG, uninduced) and presence [+IPTG, induced (++DipM)] of inducer driving expression from the plasmid. ++DipM indicates that DipM is being overproduced. (D) Outer membrane integrity was assessed during SDS sensitivity. WT cells are more resistant than the DipM depletion (↓DipM, –DipM) or DipM overproduction (+IPTG, ++DipM) strains. DipM was overexpressed (+IPTG, ++DipM) for 4 h before the SDS treatment and plated on LB plates. (E) Phase contrast images of DipM depleted cells (–DipM) for 0, 6, 12, 14, and 16 h in liquid LB. Arrowheads indicate main DipM depletion phenotypes: yellow arrowheads, mid-cell bulges; green arrowheads, tip-splitting events; white arrowheads, increased cell length; red arrowheads, bent/kinked cells. Boxed cells are additional examples of the field. Scale bar = 2 μm. (F) Time-lapse microscopy of DipM depleted cells on LB-agarose pads for 20 h. 0* = DipM cells were pre-depleted for 6 h before starting the time-lapse to avoid overcrowding. Boxed cells are spliced from elsewhere in the field to provide additional examples of diverse morphotypes. Time in hours is indicated on the image. Scale bar = 2 μm. (G) Scanning electron microscopy of WT and DipM depleted cells for 9 h (scale bar = 4 μm). Arrowheads indicate main DipM depletion phenotypes: yellow arrowheads, mid-cell bulges; blue arrowheads, cell filamentation. (H) Thin section transmission electron microscopy of WT and DipM-depleted cells for 16 h. Scale bar = 0.2 μm. All data collected for this figure was obtained from cells grown in LB.

