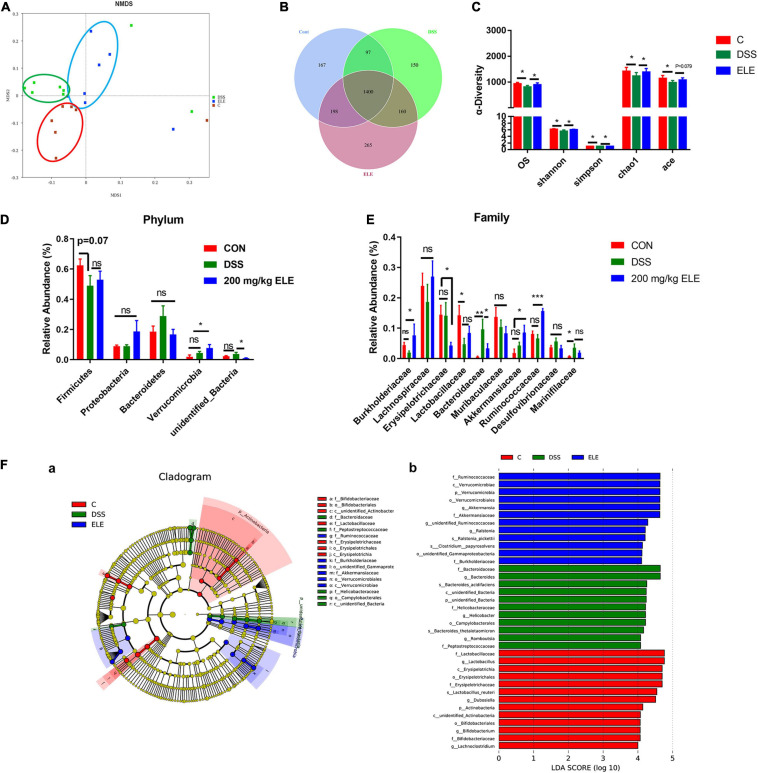
FIGURE 3.
Effects of ELE on the gut microbiota in mice. (A) The NMDS plot of gut microbiota. (B) The Venn plot based on OTUs of gut microbiota. (C) The OS, diversity, and abundance index of gut microbiota. (D) Oral administration of ELE regulates the microbiota of IBD mice in phylum level. (E) Oral administration of ELE regulates the microbiota of IBD mice in family level. (F) Identification of characteristic microbiota in cecal contents of mice with different treatments by LEfSe analysis, (a) LefSe taxonomic cladogram and (b) LDA score. n = 7–8 mice/group. Differences in data in mouse subjects were assessed by one-way ANOVA. *p < 0.05; **p < 0.01; ***p < 0.001. NMDS, non-metric multidimensional scaling. OTU, operational taxonomic unit; LEfse, LDA effect size; LDA, linear discriminant analysis.

