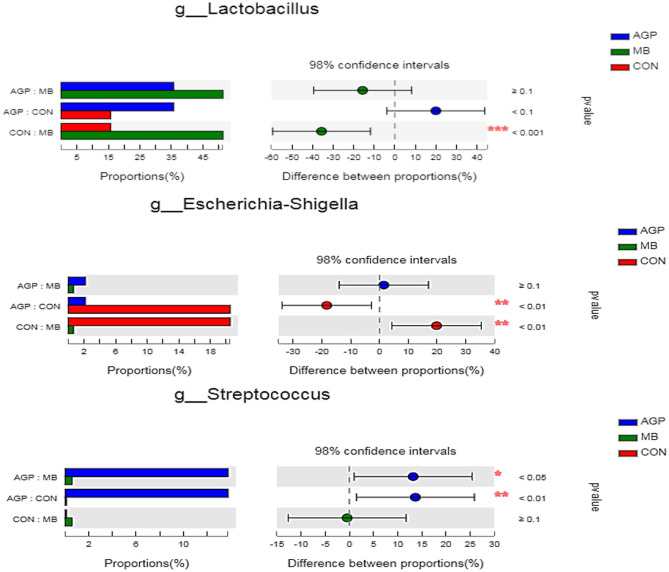
Figure 5.
Comparative analysis of 3 most relative abundances of gut microbiota at the genera level. Kruskal–Wallis test followed by Tukey test was used to evaluate the statistical significance. Asterisks express statistical differences between different groups: *0.01 < P ≤ 0.05, **0.001 < P ≤ 0.01, ***P ≤ 0.001. CON, basal diet; AGP, basal diet + 20 mg/kg flavomycin + 50 mg/kg quinocetone; MB, basal diet + 50 mg/kg Macleaya cordata extract +1,000 mg/kg benzoic acid.

