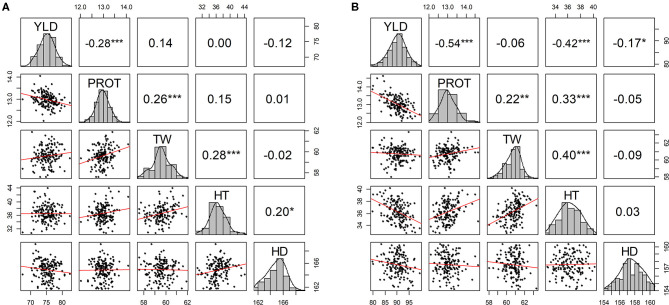
Figure 1.
Scatter plot matrix with phenotypic distributions and Pearson correlations between agronomic traits using best linear unbiased predictions (BLUPs) by combining five experimental sites (BRK, DL, HYS, OND, and WIN) (A) from the growing season of 2018–19 and (B) from the growing season of 2019–20. YLD, grain yield; PROT, grain protein content; TW, test weight; HT, plant height; and HD, days to heading. *P ≤ 0.05, **P ≤ 0.01, ***P ≤ 0.001, ****P ≤ 0.0001.

