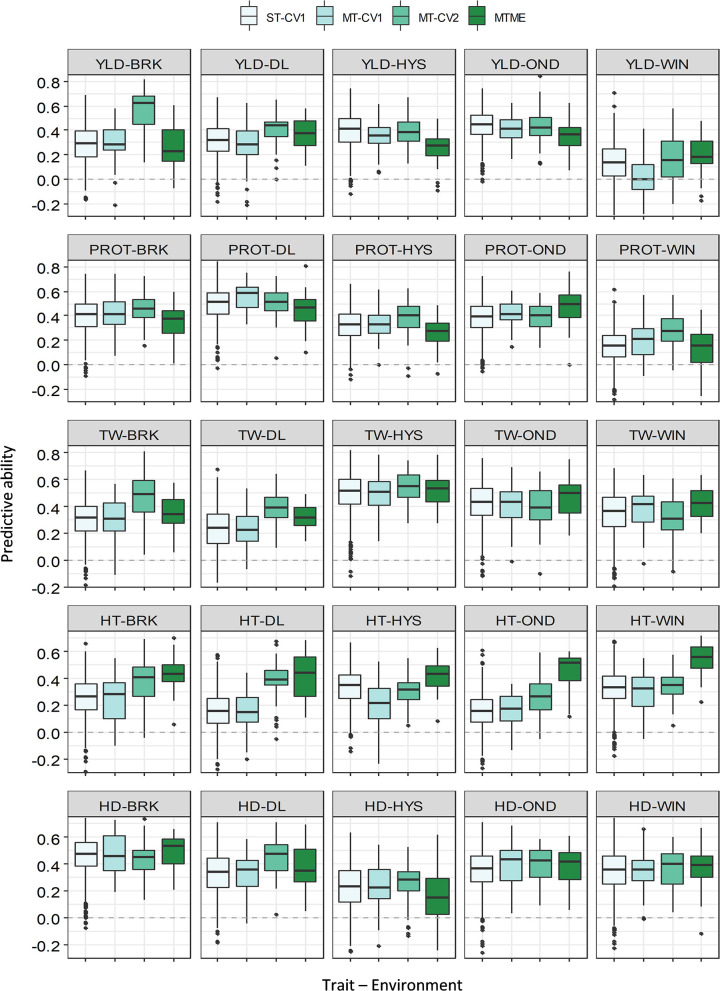
Figure 3.
Prediction accuracy (PA) for five agronomic traits evaluated in five environments in the growing season of 2018–19. Boxplots compare the PA using a single-trait prediction model with one cross-validation scheme (ST-CV1), a multi-trait prediction model with two cross-validation schemes (MT-CV1 and MT-CV2), and a Bayesian multi-trait multi-environment prediction model (MTME). Traits include YLD, grain yield; PROT, grain protein content; TW, test weight; HT, plant height; and HD, days to heading.

