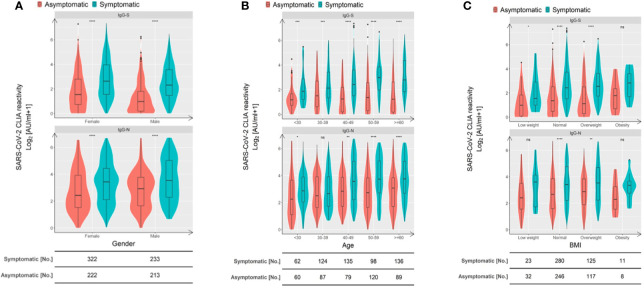
Figure 3.
Symptom occurrence is the dominant factor defining the strength of SARS-CoV-2-specific IgG responses. Comparison of RBD S- and N-specific CLIA-reactive IgG titers stratified according to sex (A), age (B), and BMI (C). Violin plots show the distribution of each antibody feature derived from asymptomatic individuals (red) and symptomatic patients (blue). Boxes depict medians (middle line), 75% quartiles (upper bound), and 25% quartiles (lower bound) with whiskers showing a 1.5-fold interquartile ranges above and below boxes. The table below the figure indicates the number of samples obtained from asymptomatic individuals and symptomatic COVID-19 patients. Statistical analysis was performed by a two-tailed Mann-Whitney U test. Asterisks depict the levels of significance as follows: ns, not significant (p ≥ 0.05); *p < 0.05; **p < 0.01; ***p < 0.001; ****p < 0.0001.

