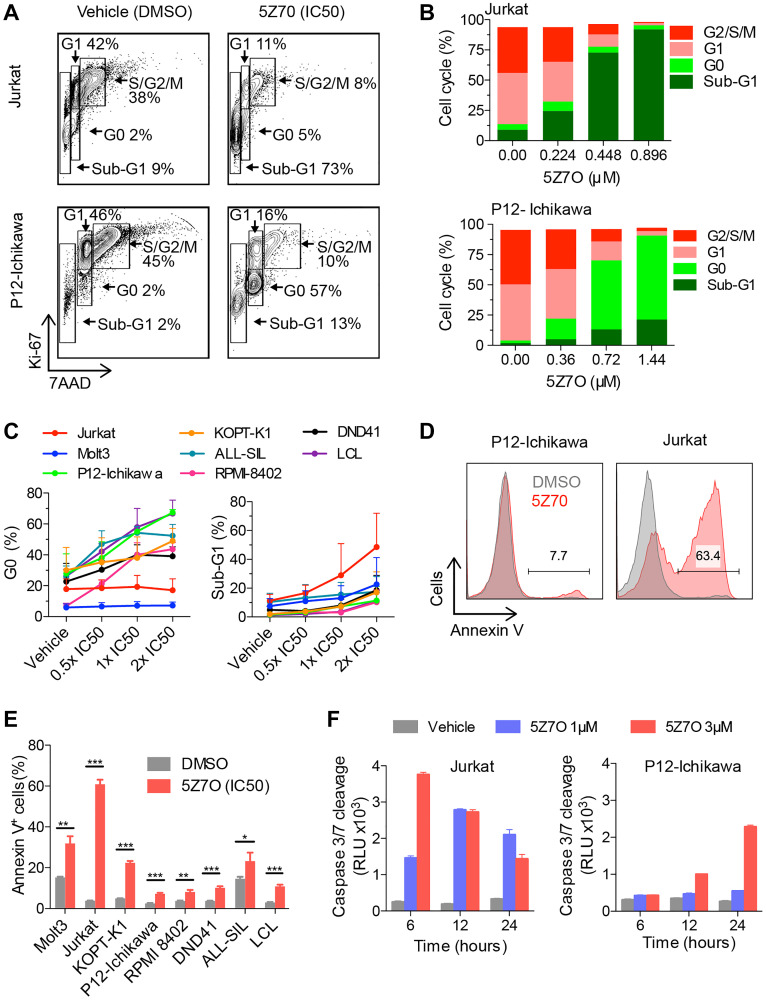
Figure 2. Treatment with 5Z7O inhibits cell proliferation and induces apoptosis in T-ALL cell lines.
(A) Representative flow cytometric analysis of nuclear staining of Ki67 and 7-AAD to identify proliferating cells and DNA content, respectively. (B) Cell cycle distribution as described in (A) shown for Jurkat and P12-Ichikawa cell lines treated with 5Z7O for 48 hours at IC50 concentration and concentrations below and over IC50. (C) Percentages of cells in G0-phase and sub-G1 are shown for all cell lines. Data in (C) represents average and SEM (n = 3). (D, E) Flow cytometry analysis of Annexin V staining in a panel of T-ALL and non-leukemic LCL cell lines following 48 hours of incubation with 5Z7O at the IC50 concentration (n = 3). (F) Time and dose dependency of 5Z7O induced cleavage of Caspase-3/7 in Jurkat and P12-Ichikawa cell lines (n = 3). Basal levels of caspase 3/7 are shown for each time point. The data represent the mean and standard deviation. * P < 0.05, ** P < 0.01, *** P < 0.001 (two-tailed Student’s t-test).

