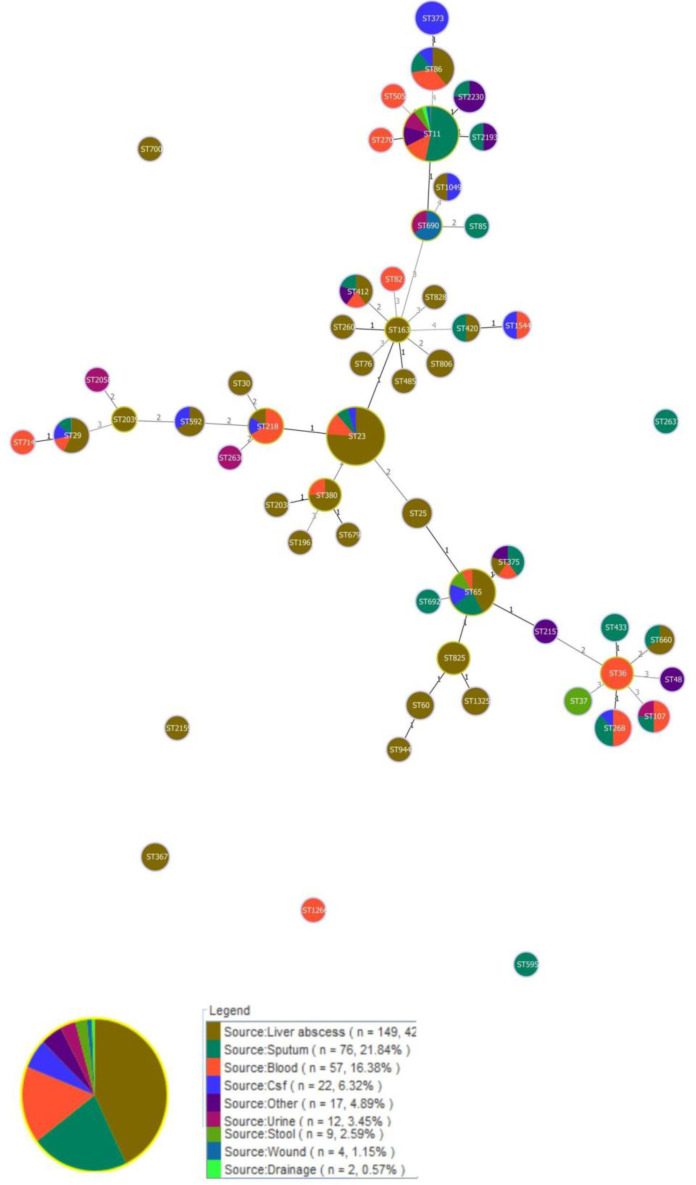
Fig. 4.
Minimum spanning tree (MST) analysis of multilocus sequence typing (MLST) data for hvKp isolates. Each circle corresponds to a sequence type (ST) that ST number is given inside each circle. The area of each circle is proportional to the number of isolates. The numbers on the connecting lines between STs correspond to the numbers of allelic differences. The circle was colored according to clinical source. The lines between STs indicate clonal relationships. MST is drawn based on the 3 allelic differences.

