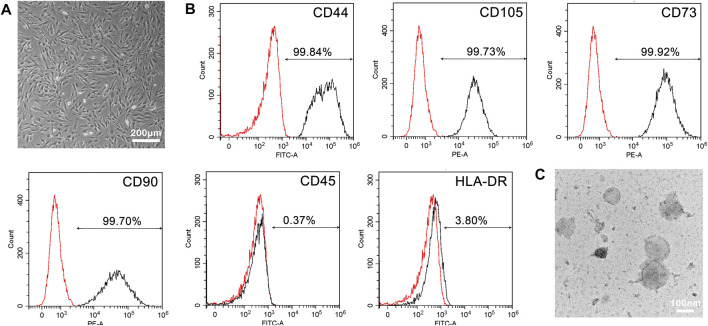
FIGURE 3.
Characterization of MSCs and MSC membranes. (A) Bright-field microscopy image of MSCs. (B) Expression of MSCs cell surface markers. Histograms showing the expression of CD44, CD105, CD73, CD90, CD45, and HLA-DR. The black and red represent the MSC marker antibody and the corresponding control antibody staining, respectively. (C) TEM image of MSC membranes.

