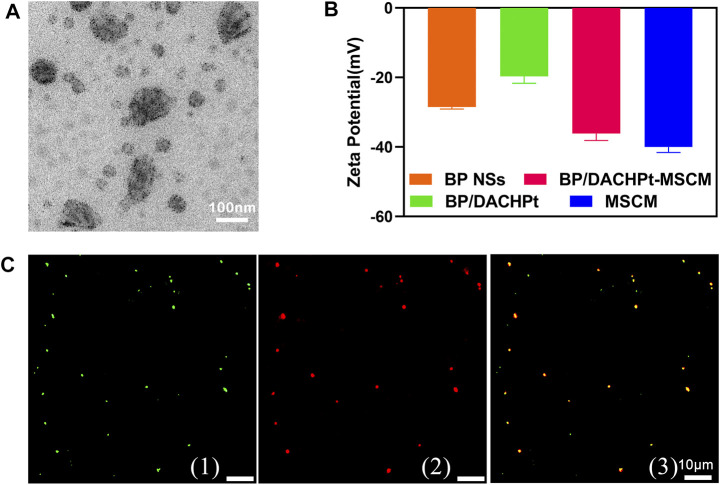
FIGURE 4.
Characterization of biomimetic nanoparticles. (A) TEM image of BP/DACHPt-MSCM nanoparticles. (B) Zeta potential of BP NSs, BP/DACHPt nanoparticles, MSC membranes, and BP/DACHPt-MSCM nanoparticles. Data present mean ± s.d. (n = 3). (C) Confocal images of fluorescence-labeled BP/DACHPt-MSCM nanoparticles: (1) the green, (2) red, and (3) yellow are the fluorescence of encapsulated BP/DACHPt nanoparticles, MSC membranes, and merged fluorescence, respectively.

