
Figure 3.
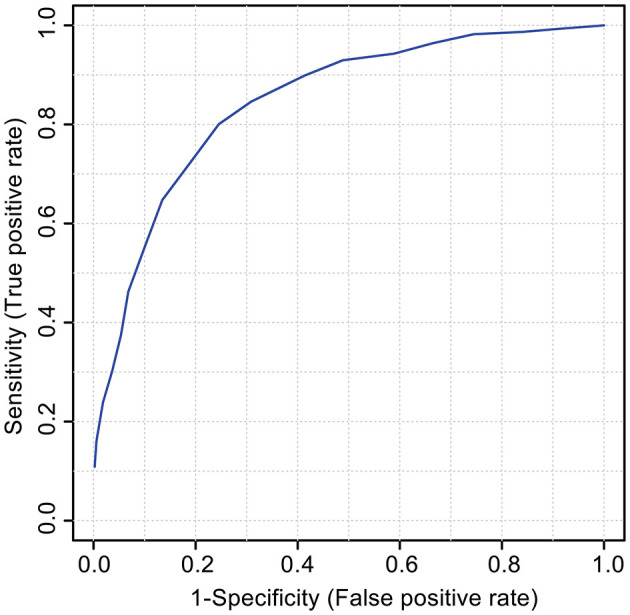
The receiver operator characteristic (ROC) curve for the VIAVC best subset of features corresponding to the metabolites provided in Table 3. The model graphs the true positive rate on the y-axis vs. the false-positive rate on the x-axis. The corresponding area under the curve (AUC) was 0.887 with a 95% confidence interval of 0.731–0.997, and the model had a predictive accuracy of 81.6%.