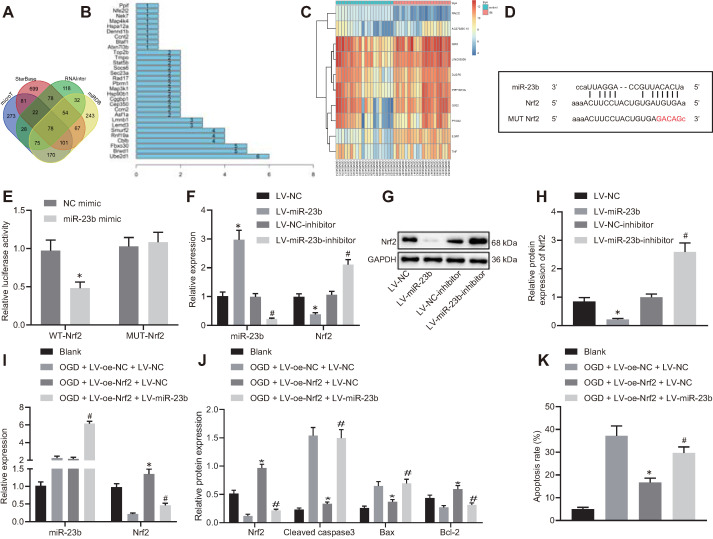
Figure 4.
miR-23b accelerates OGD-induced neuron injury through suppressing Nrf2. A, Venn diagram displaying the prediction results on downstream target genes of miR-23b obtained from MicroT data (http://diana.imis.athena-innovation.gr/DianaTools/index.php?r=microT_CDS/index), StarBase database (http://starbase.sysu.edu.cn/), RNAInter database (http://www.rna-society.org/rnainter/) and miRDB database (http://www.mirdb.org/). B, Interaction analysis results of 78 target genes from STRING (https://string-db.org/). The X-axis indicated the number of genes that could interact with genes corresponding to the Y-axis, and the Y-axis indicated the gene name. C, Heatmap displaying top 10 differentially expressed genes from microarray database GSE22255. D, Binding sites between miR-23b and Nrf2-3'UTR. E, Dual luciferase reporter assay for detection of luciferase activity, *p < 0.05 vs. NC-mimic treatment. F, Expression of miR-23b and Nrf2 in mouse cerebral cortical neurons assessed by RT-qPCR. G, Western blots of Nrf2 in mouse cerebral cortical neurons. H, Nrf2 protein band in mouse cerebral cortical neurons detected by Western blot analysis. I, miR-23b and Nrf2 expression in mouse cerebral cortical neurons measured by RT-qPCR. J, Protein expression of Nrf2, Bax, Bcl-2, and cleaved caspase-3 in mouse cerebral cortical neurons detected by Western blot analysis. K, Flow cytometry for detection of neuron apoptosis in mouse cerebral cortex. In panels F-H: * p < 0.05 vs. LV-NC; # p < 0.05 vs. LV-NC-inhibitor. In panels I-K: * p < 0.05 vs. OGD + LV-oe-NC+LV-NC group; # p < 0.05 vs. OGD + LV-oe-Nrf2 + LV-NC group. Measurement data were expressed as mean ± standard deviation. Unpaired t test was performed for data comparison between two groups. One-way ANOVA was conducted for multi-group data comparison, followed by Tukey's post hoc test. The experiment was repeated three times independently.

