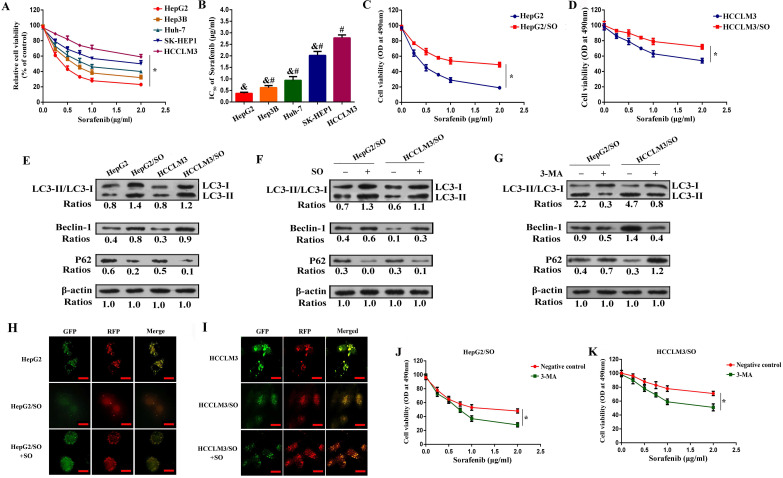
Figure 1.
Autophagy level was increased in HepG2/SO and HCCLM3/SO cells. (A-B) SO cytotoxicity for Hep3B, HepG2, Huh-7, HCCLM3, and SK-HEP-1 cell lines was examined by cell viability assay. * One-way ANOVA was used, and P<0.05; # Compared with HepG2 group, P<0.05; & Compared with HepG2 group, P<0.05. (C) The IC50 for HepG2/SO cells was examined by cell viability assay. *One-way ANOVA was used, and P<0.05. (D) The IC50 for HCCLM3/SO cells was examined by cell viability assay. * One-way ANOVA was used, and P<0.05. (E) The Beclin-1 level and LC3-II/LC3-I ratio dramatically increased, while the P62 level prominently decreased in HepG2/SO and HCCLM3/SO cells, as compared with the parental cells. (F) Treatment with SO (1.93±0.27 µg/ml for HepG2/SO cells; 5.06±0.89 µg/ml for HCCLM3/SO cells) for 24h resulted in more significant changes in the autophagy biomarkers. (G) Treatment with 5mM 3-MA for 24 h prominently restored SO sensitivity in HepG2/SO and HCCLM3/SO cells, verified by the decrease in IC50 value. (H-I) The RFP-GFP-LC3 in autolysosomes was increased in SO-treated HCCLM3/SO and HepG2/SO cells tested by fluorescence microscope. * Compared with RFP+GFP+ group, P<0.05. (J-K) Treatment with 5mM 3-MA for 24 h prominently restored SO sensitivity in HepG2/SO and HCCLM3/SO cells (cell viability assay was used), verified by the decrease in IC50 value. * One-way ANOVA was used, and P<0.05. SO: Sorafenib; IC50: half maximal inhibitory concentration; 3-MA: 3-Methyladenine. The scale bar is 10 um.

