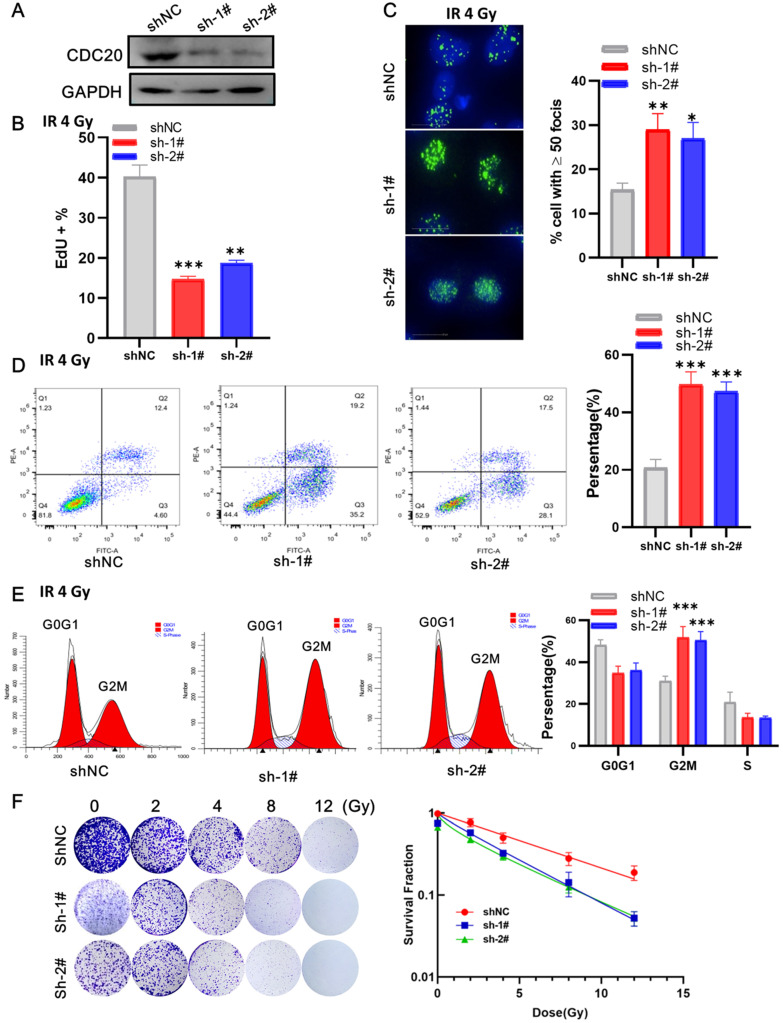
Figure 6.
CDC20 knockdown promotes radiosensitivity of Hep3B cells. A. The protein expression level of CDC20 detected by WB. B. The cell proliferation of each group detected by EdU assay. C. The number of γH2AX foci measured by High-Content Imaging System. D. Apoptotic cells analyzed by flow cytometry 24 h after irradiation. E. Flow cytometry was used to determine the percentage of cells in G1, S and G2/M phase. F. Representative crystal violet staining of the colonies formed by Hep3B cells treated with control, and shCDC20 combined with irradiation. Data are presented as means ± SD. *P < 0.05, **P < 0.01, ***P < 0.001 versus the shNC.

