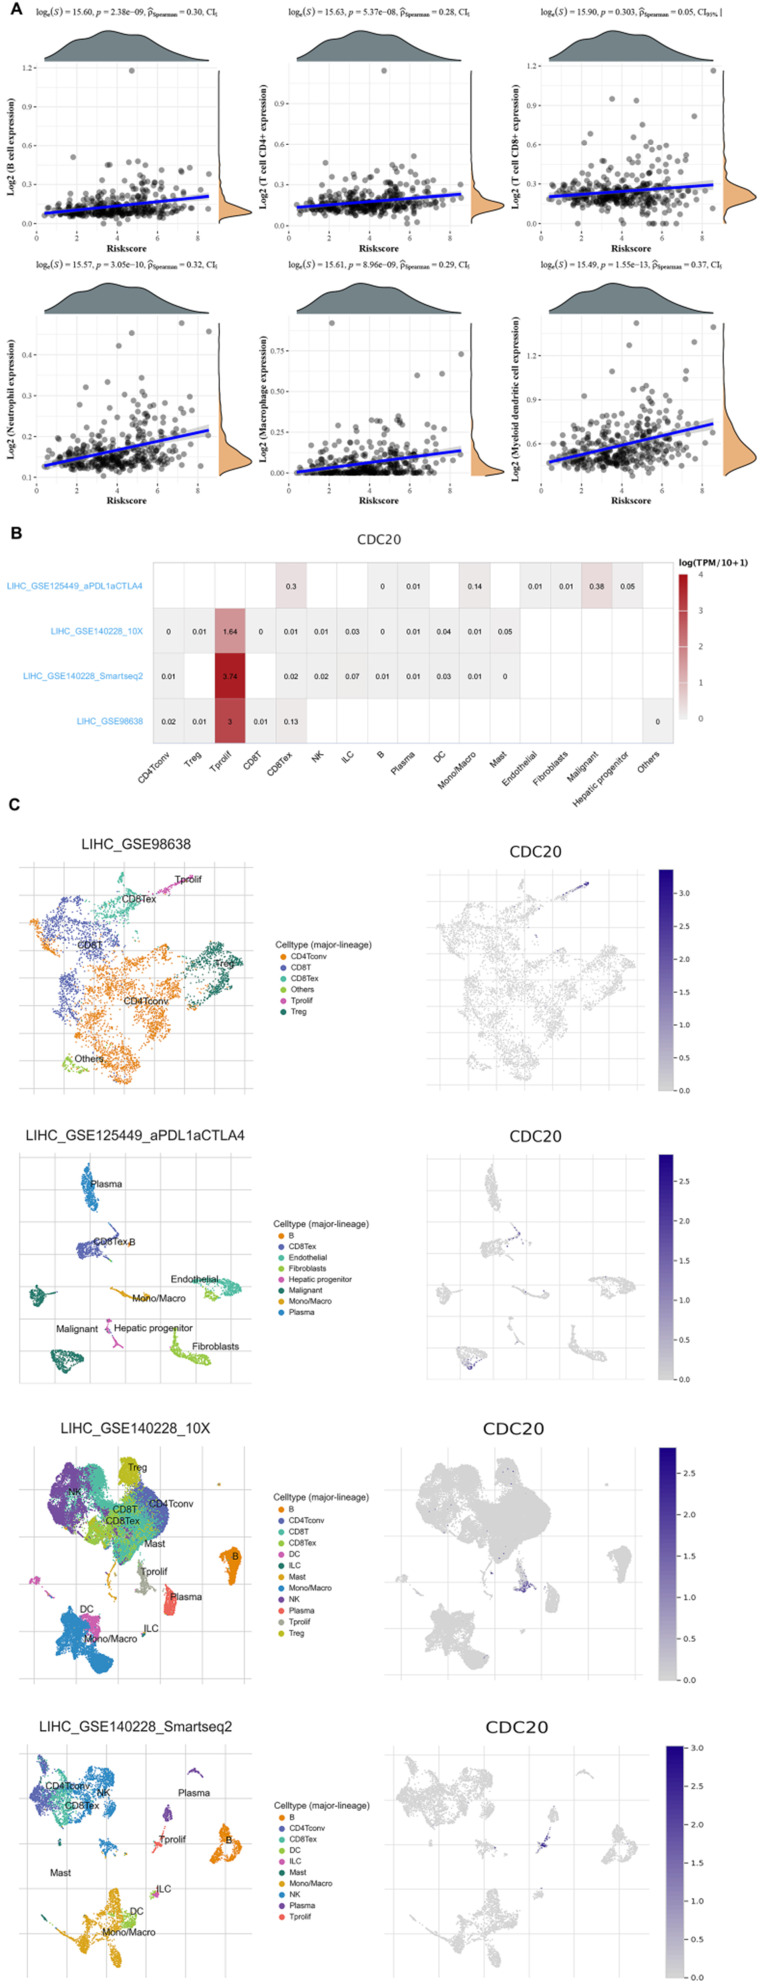
Figure 9.
Correlation analysis of CDC20 in the immune microenvironment of HCC. A. Spearman correlation analysis of CDC20 expression and score. The horizontal axis in the figure represents the expression distribution of the gene, and the ordinate is the expression distribution of the score. The density curve on the right represents the distribution trend of the score;the upper density curve represents the distribution trend of the gene;the top side The value represents the correlation p value, correlation coefficient and correlation calculation method. B. We quantitatively calculated the positioning and binding of CD3E on various immune cells across the dataset using a heatmap. C. Four single-cell RNA-seq datasets were enrolled to determine the location of CD3E in different cell.

