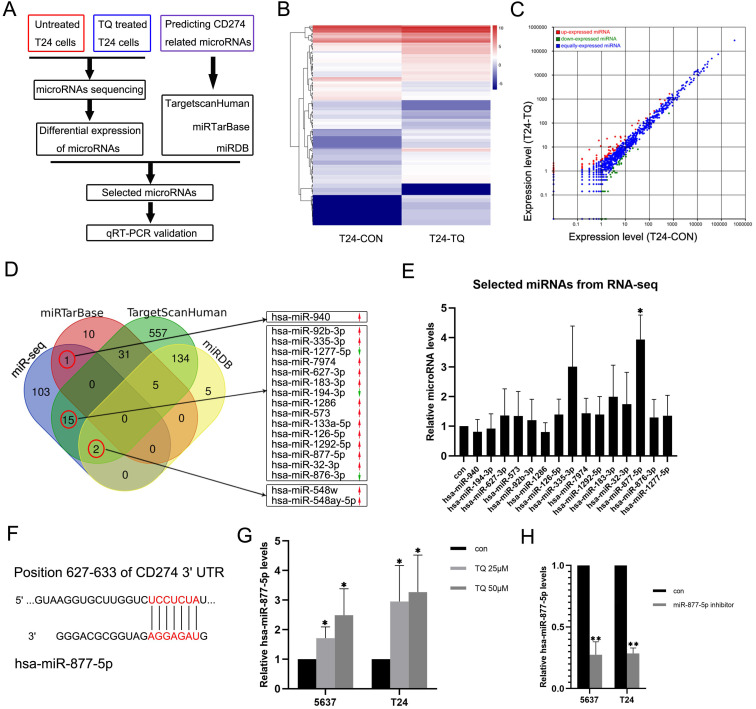
Figure 6.
TQ upregulates the miR-877-5p level in BC cells. (A) The flow diagram of selecting the potential microRNAs related to the TQ treatment. (B, C) Heat map and scatter diagram of microRNA sequencing demonstrating the differential expressions between control and TQ treated group. (D) Venn diagram shows the overlapping microRNAs of sequencing results and three online databases (miRTarBase, TargetScanHuman and miRDB), with red arrows representing the relative high expression microRNAs compared to control while green arrows meaning the low expression. (E) qRT-PCR validation of selected microRNAs in T24 cells. (F) The predicted binding site of miR-877-5p and 3'UTR region of CD274 mRNA. (G) qRT-PCR testing the levels of miR-877-5p in TQ treated BC cells. (H) T24 and 5637 cells were transfected with inhibitor of miR-877-5p and qRT-PCR was conducted to detect the levels of miR-877-5p. Statistics are exhibited as the mean ± SD of three independent experiments. *p<0.05, **p<0.01.

