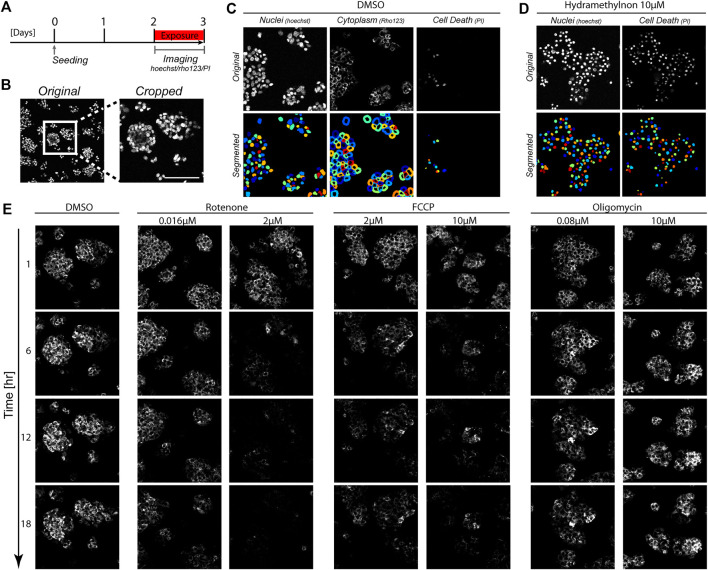
FIGURE 1.
Image-based measurements over time in HepG2 cells. (A) Schematic representation of the experimental set-up. HepG2 cells were imaged for 24 h to track Rho123 (MMP), Hoechst (cell nuclei) and PI (necrosis) abundance following 2 days of cell seeding. (B) Representative images showing original image dimensions and a cropped image. (C, D) Images of Hoechst, Rho123 and PI staining (top panels) and the resulting segmentation from CellProfiler (bottom panels). Images originate from a vehicle treated condition with 0.2%DMSO for 1 h (C) or a toxic condition with 10 μM Hydramethylnon exposure for 24 h (D). (E) Representative Rho123 images over time upon exposure to 0.2% DMSO, or to rotenone, antimycin A or oligomycin at the indicated concentrations for 1, 6, 12, and 18 h.

