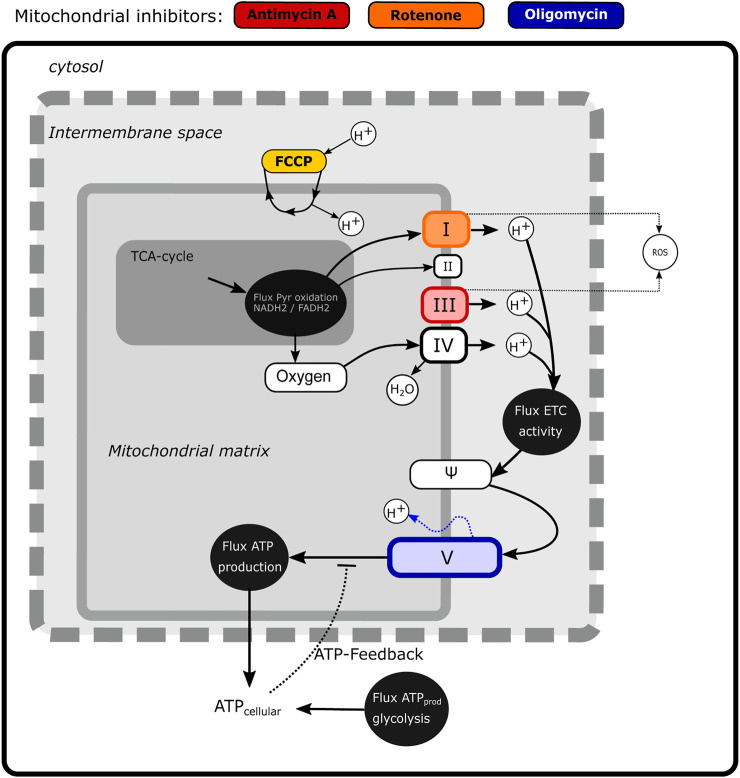
FIGURE 2.
Scheme illustrating mechanistic information on mitochondrial energy generation and modeled components. The state variables that are included in the model (Oxygen and Ψ) are shown in the white boxes, while fluxes are depicted by black circles. The non-modelled TCA cycle is indicated in dark gray. The sites of action of four classical mitochondrial inhibitors (FCCP, antimycin A, rotenone and oligomycin) are shown in color.

