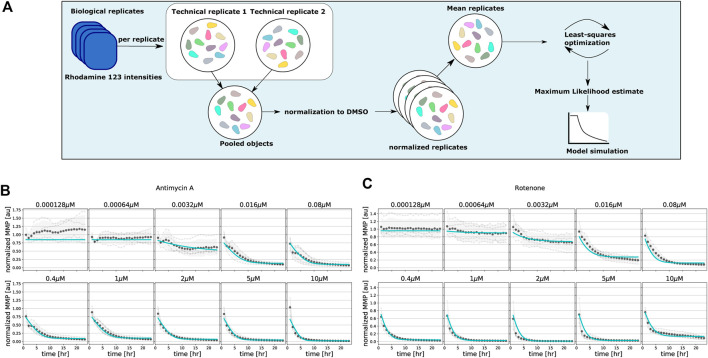
FIGURE 3.
Model fitting to classical mitochondrial inhibitors antimycin A and rotenone. (A) Flowchart illustrating the steps for single-cell analysis, normalization and model parameter estimation. (B, C) Quantified MMP dynamics and model fits upon exposure of HepG2 cells to antimycin A (B) and rotenone (C) at 10 concentrations. Gray lines and symbols represent individual experimental replicates, black dots and shading represent the mean and standard deviation of all replicates, and cyan lines represent best fits with the basic model. Note that all model parameters are kept free during parameter estimation.

