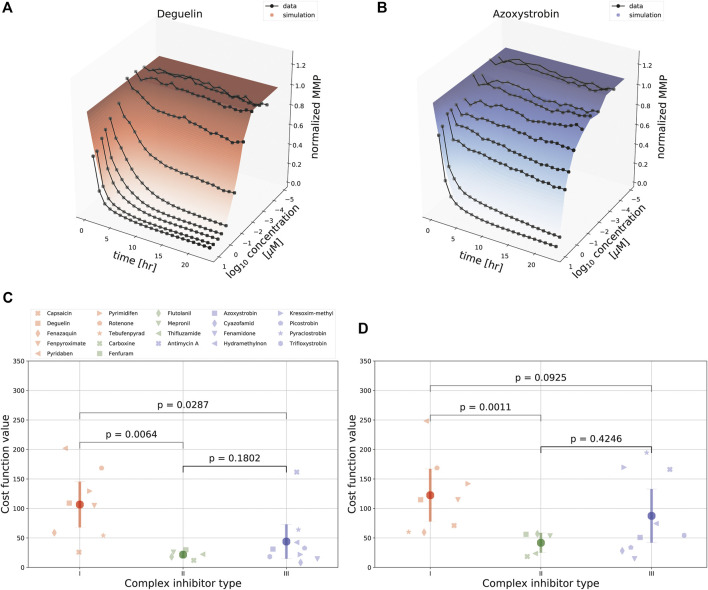
FIGURE 4.
Comparison of model fits for various ETC inhibitors. (A, B) Landscape of simulated (shaded curved planes) and experimentally determined (gray lines and symbols) concentration-time MMP response following exposure of HepG2 cells to deguelin (A) or azoxystrobin (B). Note that in these model fits several parameters were required to be the same across all 22 ETC inhibitors used in the experiments (see Section 2). (C, D) Model fitting performance for all 22 ETC inhibitors (symbols) tackling complex I (red), II (green), or III (blue), [either fitting the data for each inhibitor separately with all model parameters kept free (C), or using the combined data for fitting with particular parameters in common (D). The p-values in (C, D) are based on a KS test.

