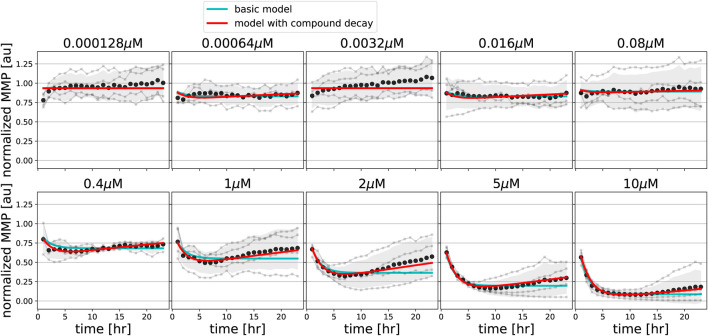
FIGURE 5.
Model extension with compound degradation is required for good fit to FCCP data. MMP data in response to various concentrations of FCCP (gray line and dots indicate individual replicates; black dots and shading indicates the mean of replicates and 95% confidence intervals of means) are shown along with model simulations for best-fitting parameters of the basic model (cyan lines) and of the model extended with compound decay (red lines).

