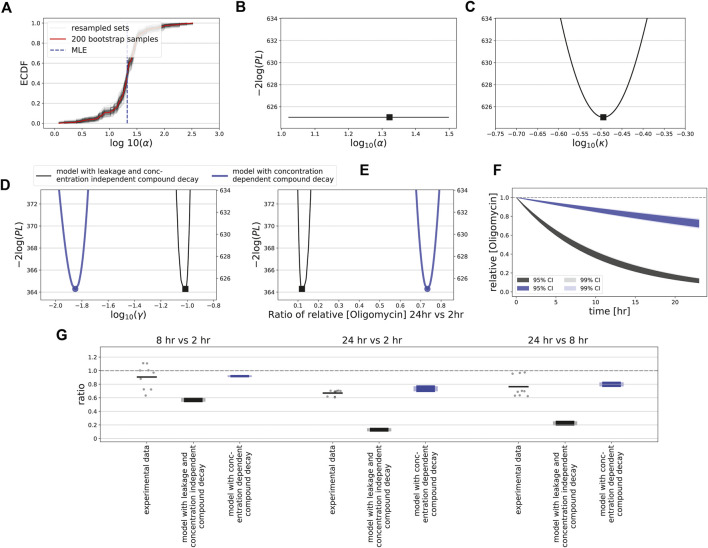
FIGURE 8.
Uncertainty quantification and measurements for oligomycin. (A) Empirically determined cumulative distribution function (ECDF) of the estimated α values for bootstrapped data. Red line shows ECDF based on all 200 bootstrap samples, gray lines show 100 resampled bootstrap sets (with replacement), and vertical blue dashed line indicates the estimated MLE of the original data. (B) Profile likelihood for the leakage rate (α), for the model with compound decay and ion leakage is utilized. (C, E) Profile likelihoods for the ensemble of parameters affecting leakage and ion flux via complex V (κ; see Supplementary Text) (C), for the oligomycin degradation rate (γ) (D), and for the ratio of effective concentrations at 24 and 2 h (E). (F) Model-predicted oligomycin dynamics within cells based on 95% (dark shadings) and 99% confidence interval (light shadings) of estimated γ values, with profile-likelihood-based CIs. In (C–F) either the model is utilized in which the structural unidentifiability of the leakage rate has been solved, with concentration-independent decay γ (black), or in which decay does depend on the oligomycin concentration with γ = γ H for high concentrations (blue). (G) Ratios between time points 2, 8 and 24 h (all possible combinations) of the LC-MS/MS-based intracellular concentrations of oligomycin after exposure to a concentration of 0.5 μM (dots indicate all possible values of the ratios based on separate measurements, and bars indicate the mean of all these ratios) and of the model-based CIs for the ratios. The model-based CIs are based on the profile likelihood analysis for a model with concentration-independent decay (black) or with concentration-dependent decay (blue), with the dark colours based on 95% CIs and light colours based on 99% CIs.

