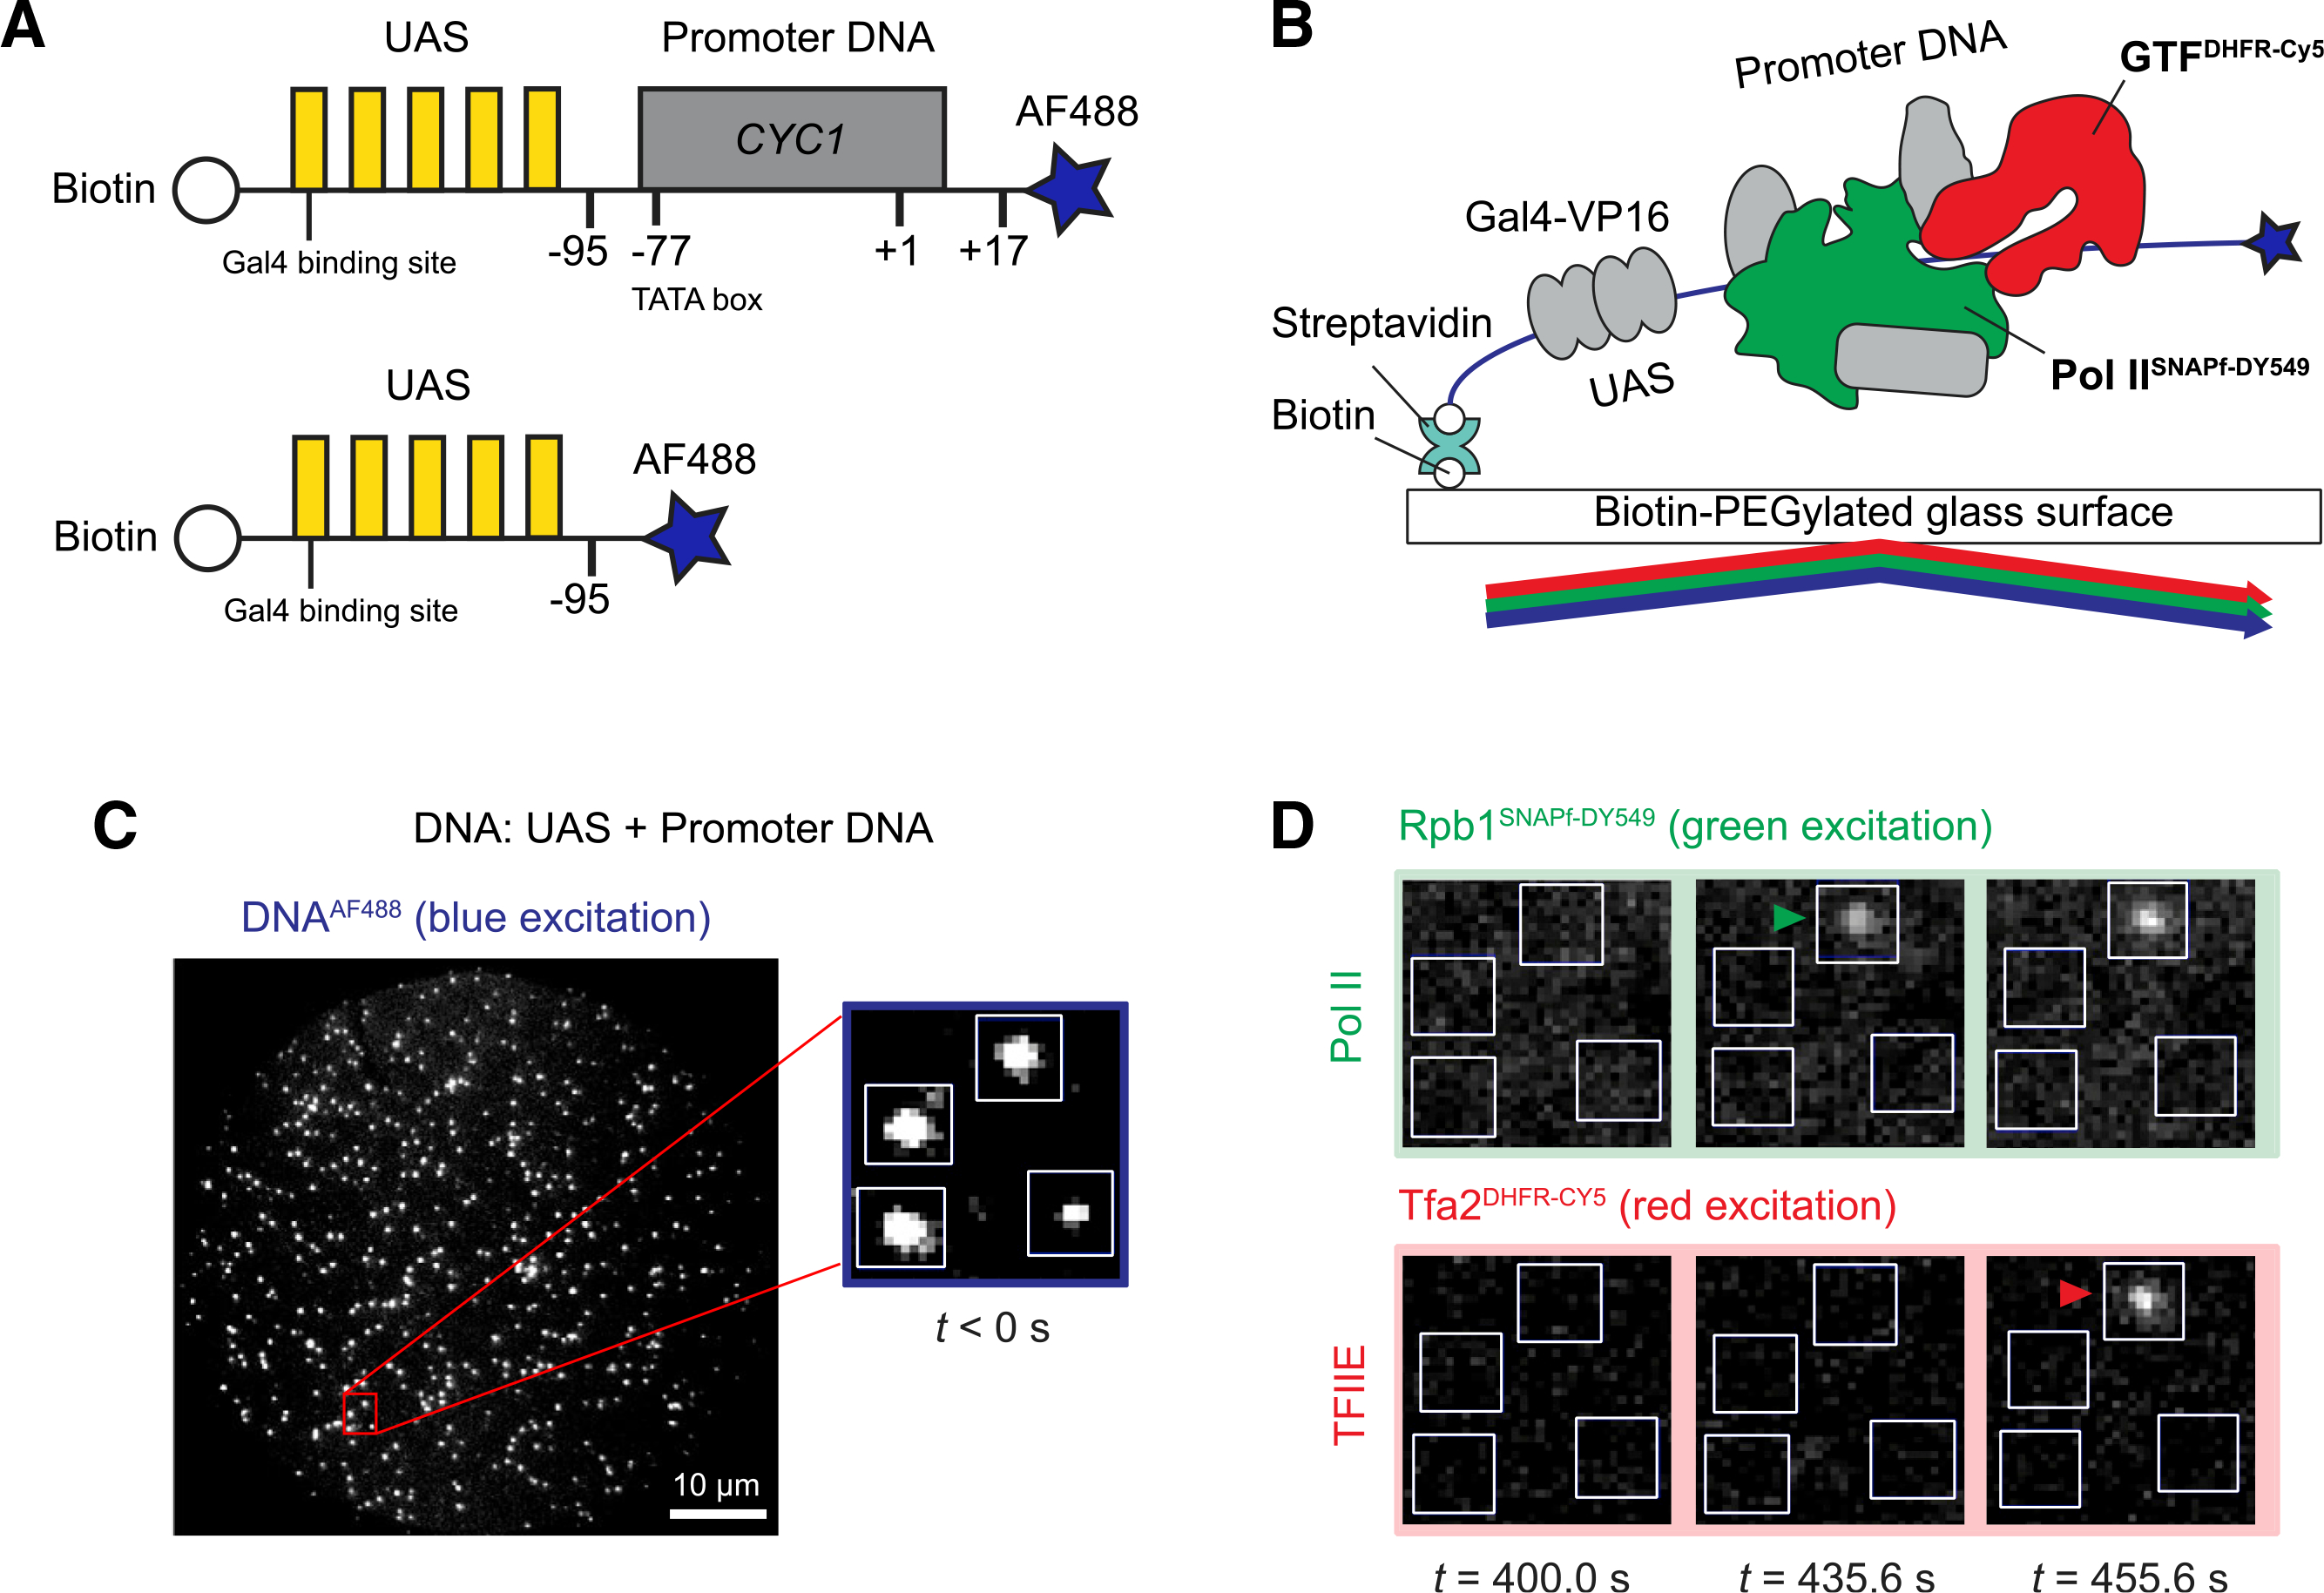
Figure 1. Single-molecule imaging of RNA Pol II and GTF binding to the DNA template.

(A) Schematic of DNA templates used. UAS+promoter (top) has five Gal4-binding sites (yellow) upstream of the CYC1 core promoter sequence (gray) carrying a TATA box (−77) and transcription start site (+1). The UAS DNA (bottom) has only the Gal4-binding sites. Both are biotinylated upstream and labeled with Alexa Fluor 488 downstream (blue star) relative to the promoter direction.
(B) Schematic of single-molecule imaging. DNAAF488 molecules were immobilized onto the passivated microscope slide surface via a biotin-streptavidin-biotin linkage and their positions mapped with blue laser excitation. Gal4-VP16 (340 nM) and yeast nuclear extract containing fluorescently labeled RNA Pol IISNAPf-DY549 and GTFDHFR-Cy5 were added and reactions were imaged with alternating excitation with green and red lasers.
(C) Representative image in the blue-excited channel showing hundreds of DNAAF488 molecules that can be simultaneously monitored in a single field of view (65 × 65 μm). The red box marks a magnified area, with 4 DNA molecules (white spots) corresponding to the boxes shown in (D).
(D) Images of the red- and green-excited fluorescence channels at three time points. The indicated time is measured from the initiation of red/green imaging (t = 0 s), which is typically within 2–3 min of extract addition. RNA Pol II and TFIIE arrivals are marked by green and red arrowheads, respectively.
See also Figure S1.
