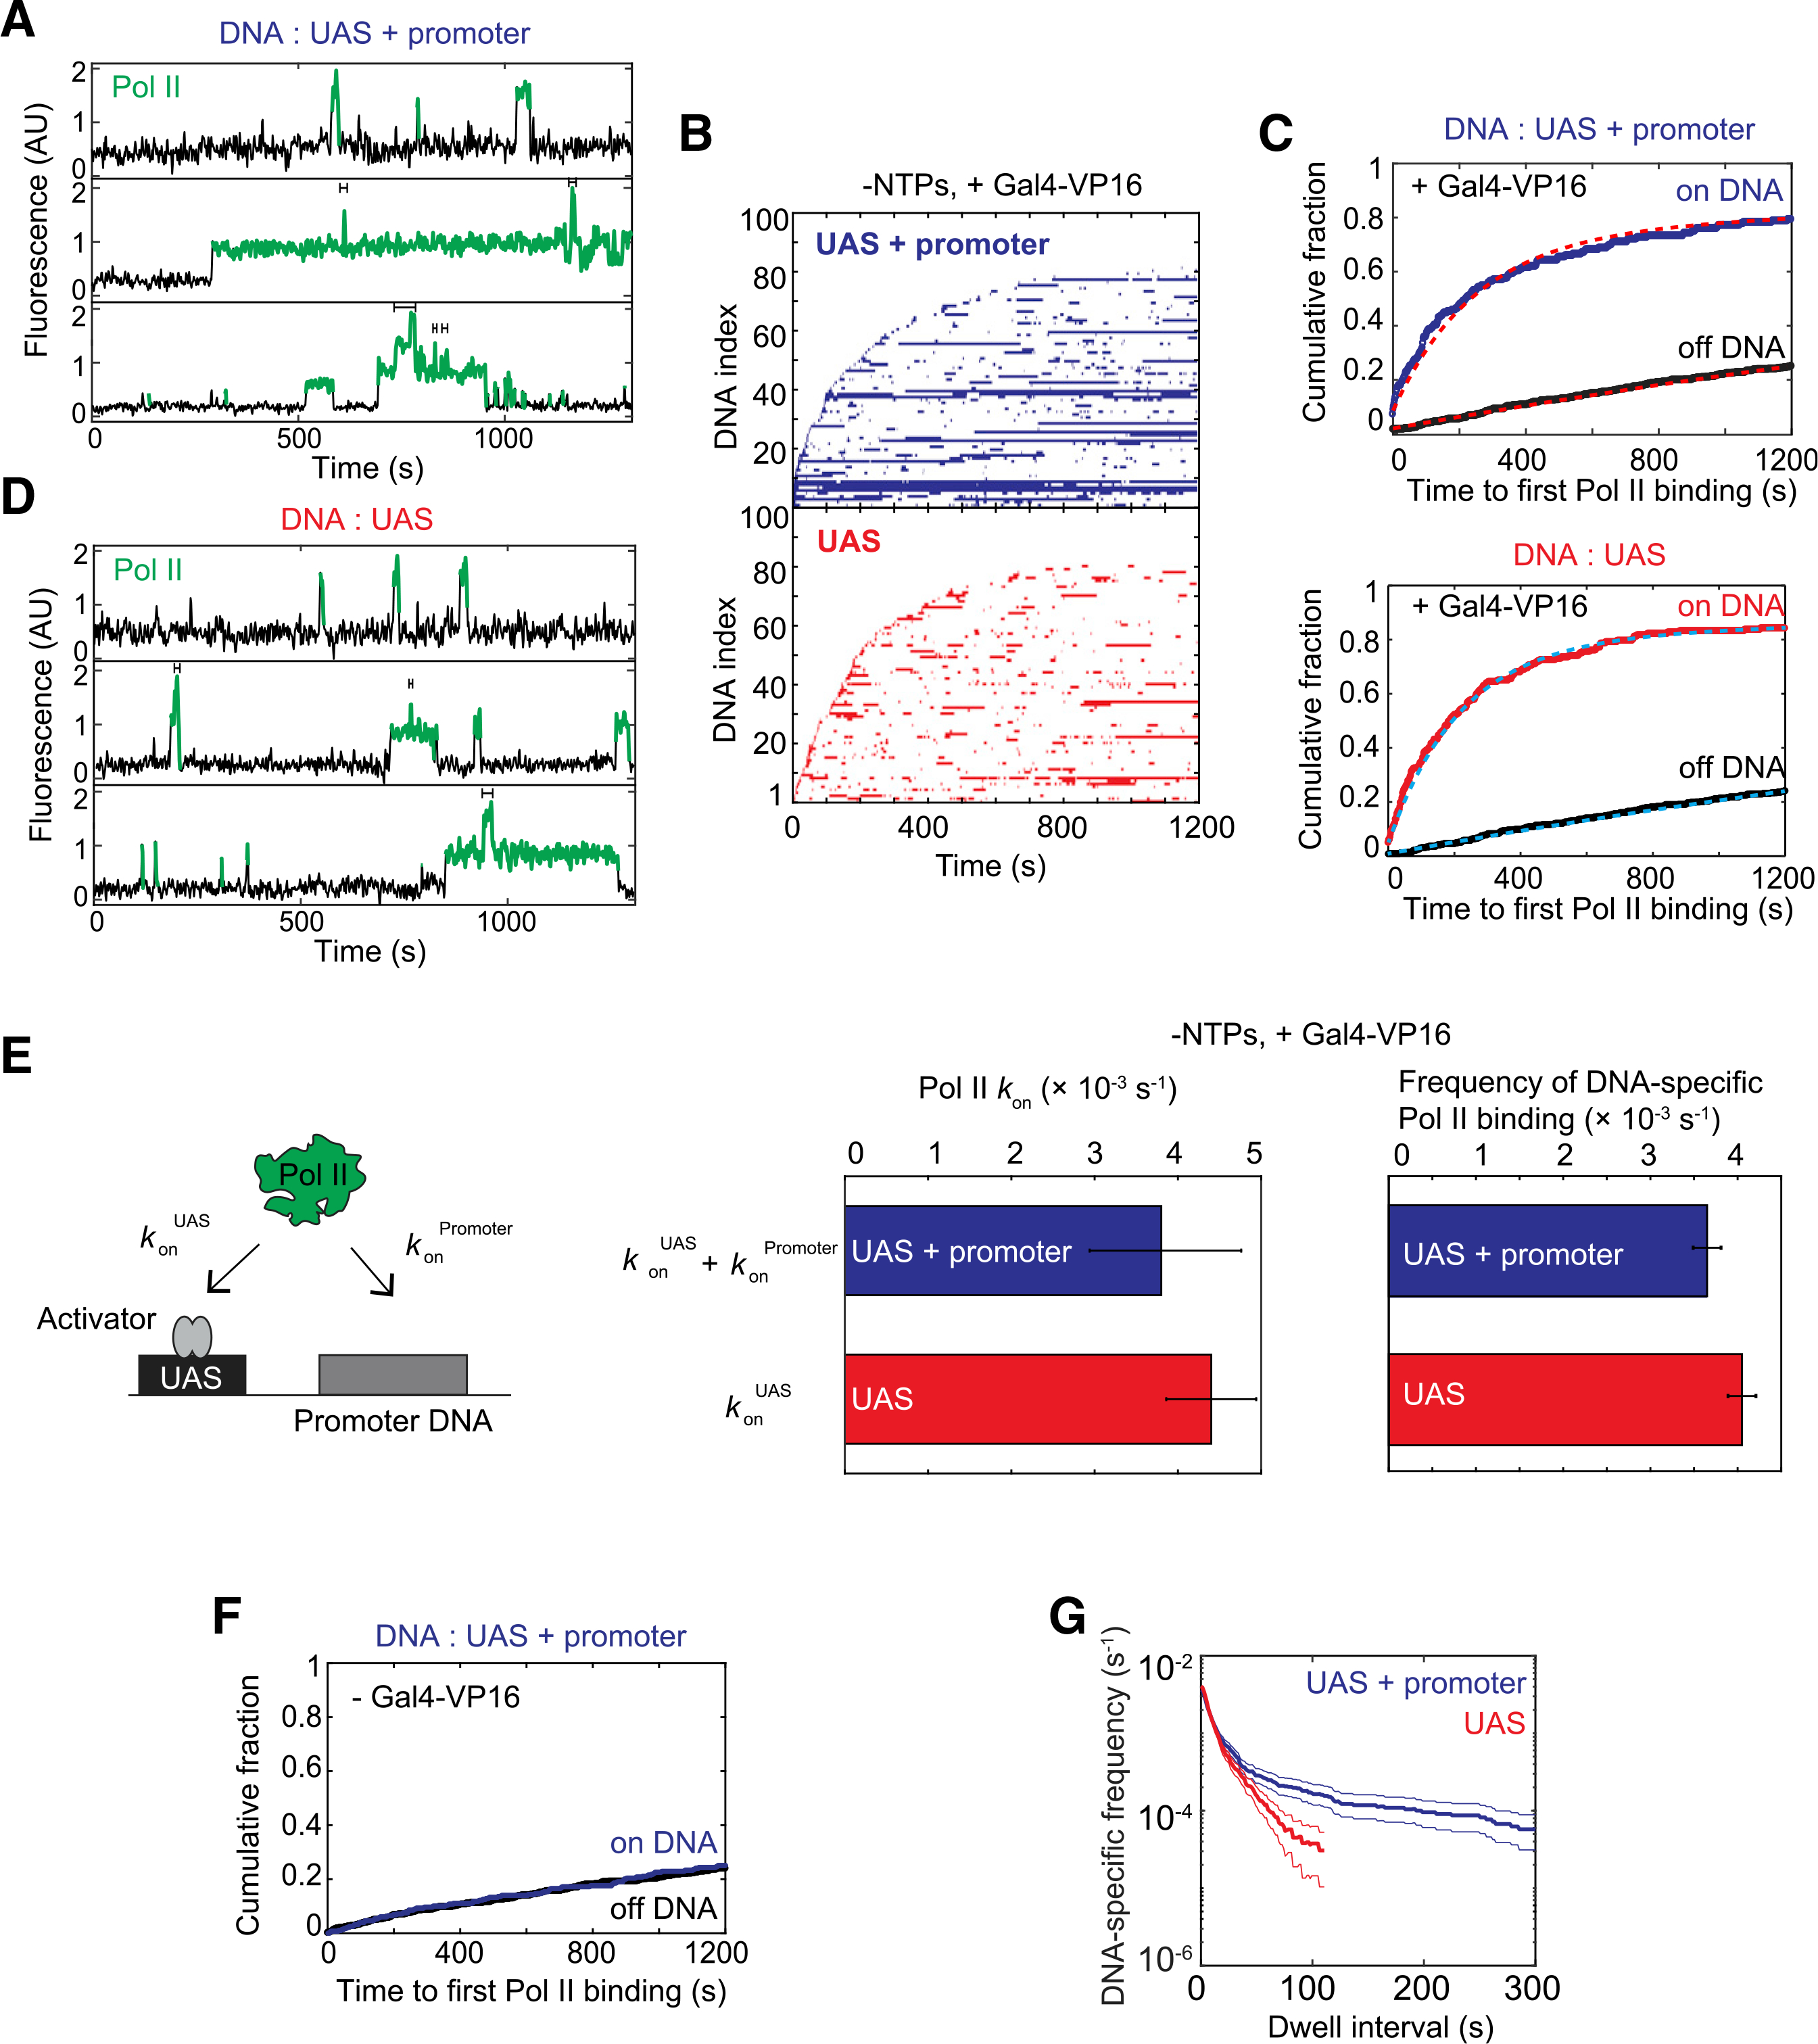
Figure 2. RNA Pol II association kinetics are independent of the core promoter.

(A) Time records of RNA Pol II fluorescence at three different UAS+promoter locations. Green-colored intervals show times when RNA Pol II colocalizes with the DNA template. Brackets above traces mark when multiple RNA Pol II molecules are simultaneously bound to the same DNA.
(B) Rastergrams show RNA Pol II binding to 100 randomly selected DNA locations, ordered by time of first RNA Pol II detection. Each horizontal line represents a single DNA location, and a colored band indicates ≥1 colocalized RNA Pol II molecules. The top panel data (blue) show UAS+promoter, while the bottom panel data (red) show UAS only. Note that both templates were simultaneously imaged on the same slide surface to ensure identical conditions. This reaction contained Gal4-VP16 activator, but lacked NTPs.
(C) Cumulative fraction of DNA molecules bound at least once by RNA Pol II as a function of time (top: UAS+promoter, blue; bottom: UAS, red). Binding to off DNA sites (black) is shown as a control for background. Data were fit to a single exponential specific binding model (dashed lines). Fit parameters and numbers of observations for all fits are given in (E) (center) and Table S4.
(D) Time records of RNA Pol II fluorescence at three different UAS locations, plotted as in (A).
(E) Schematic at left shows two pathways for initial RNA Pol II association with the DNA template: (1) RNA Pol II recruitment to UAS-bound activator (rate constant konUAS) and (2) direct RNA Pol II recruitment to core promoter (konPromoter). The center panel shows apparent first-order rate constants (±SE) of RNA Pol II initial association with the UAS+promoter (blue) or UAS (red) calculated from curve fitting in (C). The right panel shows DNA-specific binding frequencies (±SE) of total (initial + subsequent) RNA Pol II binding to RNA Pol II-unoccupied DNA.
(F) Cumulative fraction of RNA Pol II-bound DNA versus time for UAS+promoter (blue) or off DNA sites (black), in the absence of Gal4-VP16.
(G) Cumulative distribution of RNA Pol II dwell intervals on UAS+promoter (blue) or UAS (red) with 90% confidence intervals (thin lines). Each continuous time interval with ≥1 labeled RNA Pol II molecules present was scored as a single dwell. Frequency values on the vertical axis include subtraction of off DNA background. Values of ≤0 after background subtraction are not plotted, which is why the UAS curve only extends to ~100 s.
See also Figure S2.
