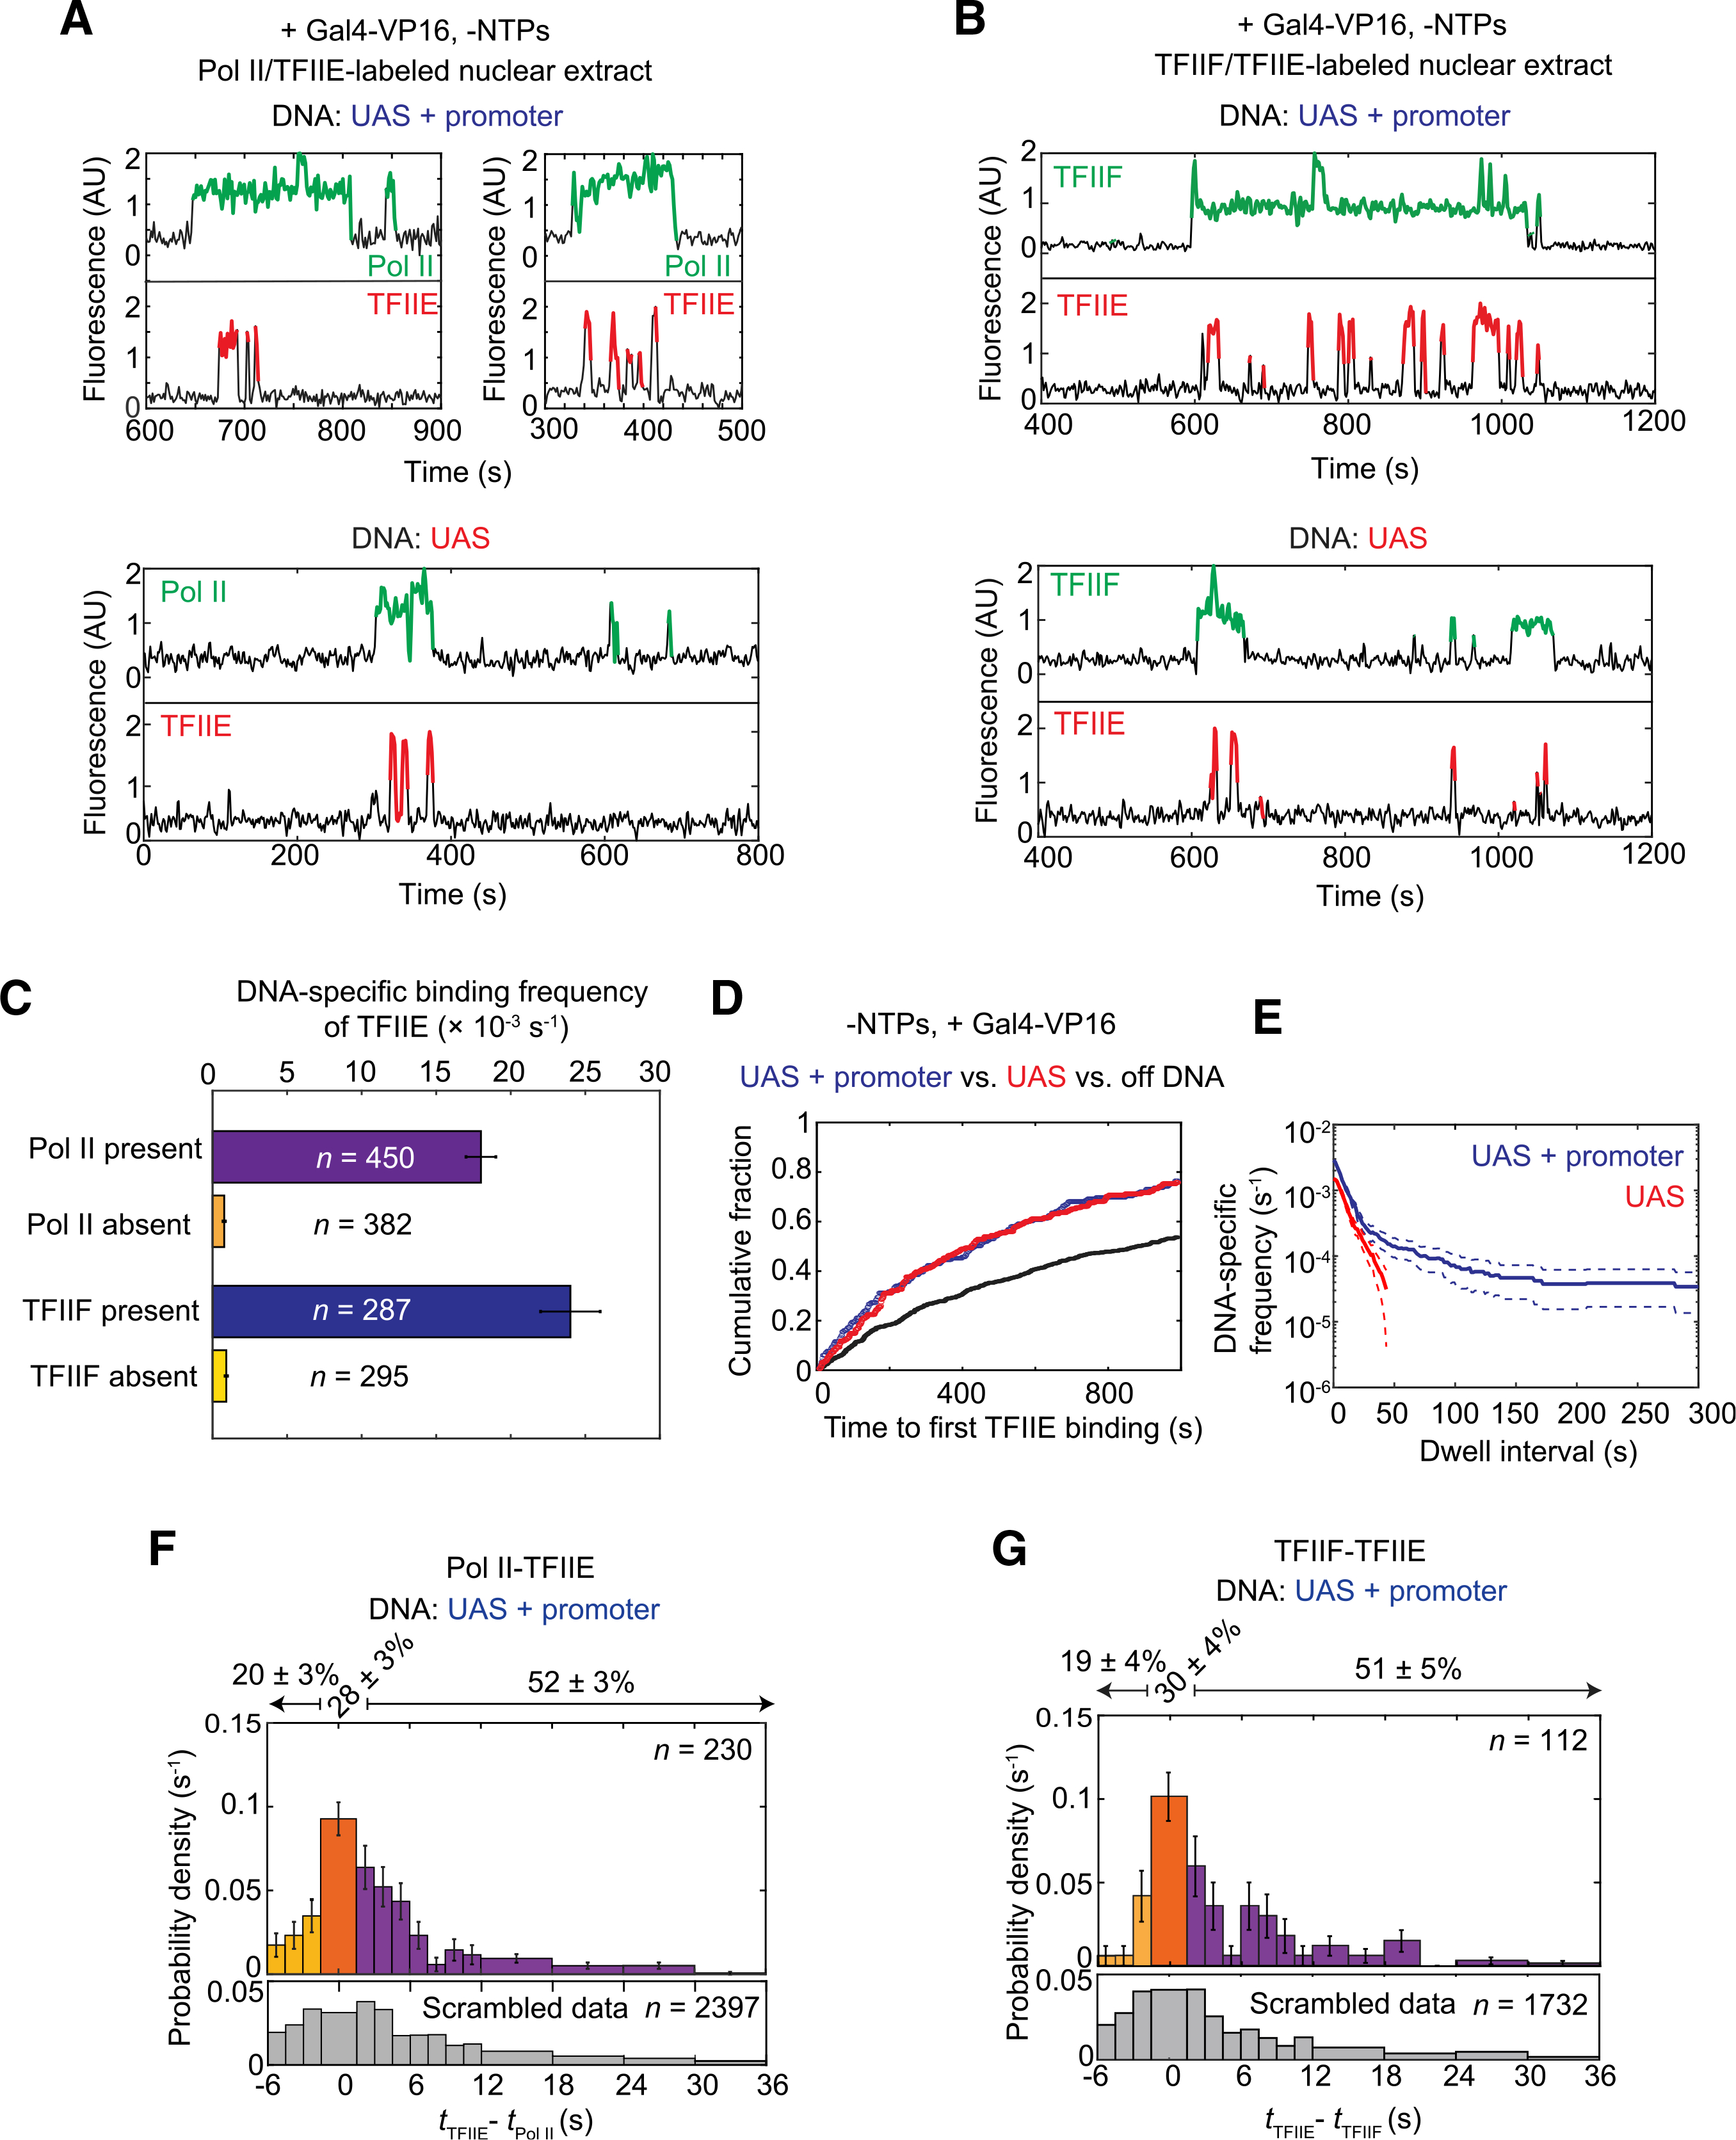
Figure 4. Dynamics of TFIIE relative to RNA Pol II and TFIIF during activator-dependent PIC assembly.

(A) Representative time records at two UAS+promoter molecules (top) and one UAS molecule (bottom) for RNA Pol II (green) and TFIIE (red) colocalization with DNA.
(B) Time records at one UAS+promoter molecule (top) and one UAS molecule (bottom) for TFIIF (green) and TFIIE (red) colocalization with DNA.
(C) DNA-specific binding frequencies (±SE) of TFIIE during time intervals when RNA Pol II was present (purple) or absent (orange), and when TFIIF was present (blue) or absent (yellow) at UAS+promoter. n = number of TFIIE binding events used in each calculation.
(D) Cumulative distributions over time for the fractions of the UAS+promoter (blue), UAS (red), and off DNA sites (black) bound at least once by TFIIE.
(E) Cumulative distribution of TFIIE dwell intervals on UAS+promoter (blue) or UAS (red), with 90% confidence intervals (dashed lines). Frequency values are after subtraction of off DNA background; values of ≤0 are not plotted.
(F) Histogram of probability density (±SE) for time differences between TFIIE and RNA Pol II arrival times (tTFIIE – tRNA Pol II) at unoccupied UAS+promoter DNA, plotted as in Figure 3B (83% of the tTFIIE – tRNA Pol II values are within shown range).
(G) Histogram of probability density (±SE) for time differences between TFIIE and TFIIF arrival times (tTFIIE – tTFIIF) at occupied UAS (80% of the tTFIIE – tTFIIF values shown).
Simultaneous RNA Pol II and TFIIE fluorescence imaging was done using Rpb1SNAPf-DY549/Tfa2DHFR-Cy5 nuclear extract from YSB3474, while TFIIF and TFIIE co-imaging used Tfg1SNAPf-DY549/Tfa2DHFR-Cy5 nuclear extract from YSB3553 (Table S1). Data in (D) and (E) are from YSB3474.
See also Figures S4 and S5.
