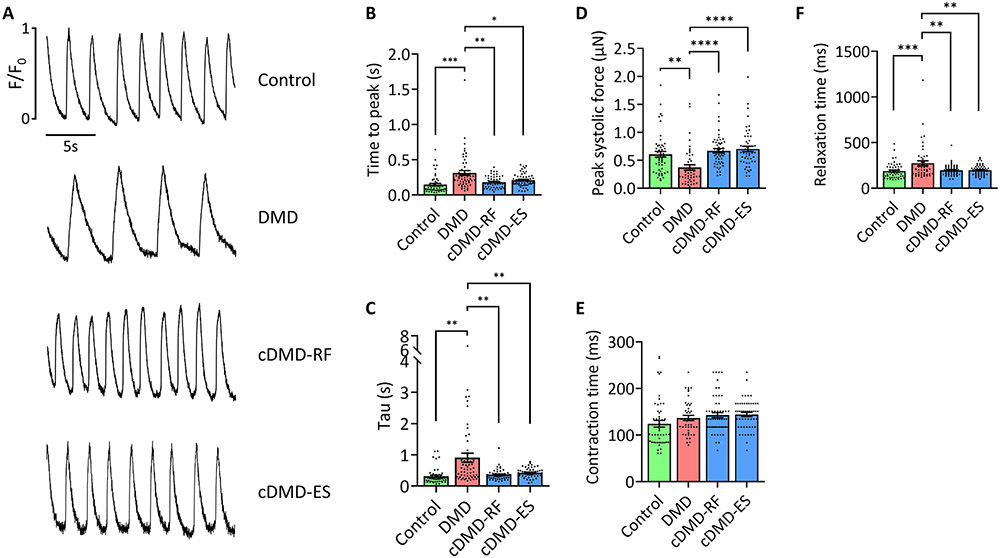
Figure 2. Corrected DMD CMs show normal functional characteristics.
A) Representative calcium traces of single control, DMD and cDMD CMs loaded with the calcium indicator Fluo 4-AM.
B) Quantification of the calcium release phase in single control, DMD and cDMD CMs as shown by time to peak (n = 50 cells for control CMs, n = 56 cells for DMD CMs, n = 52 cells for cDMD-RF CMs, n = 54 cells for cDMD-ES CMs; quantification was performed across three independent batches of differentiation).
C) Quantification of the calcium reuptake phase in single control, DMD and cDMD CMs as shown by tau (n = 50 cells for control CMs, n = 56 cells for DMD CMs, n = 52 cells for cDMD-RF CMs, n = 54 cells for cDMD-ES CMs; quantification was performed across three independent batches of differentiation).
D) Quantification of contractile force of single control, DMD and cDMD CMs (n = 52 cells for control CMs, n = 46 cells for DMD CMs, n = 55 cells for cDMD-RF CMs, n = 52 cells for cDMD-ES CMs; quantification was performed across three independent batches of differentiation).
E) Quantification of contraction time of single control, DMD and cDMD CMs (n = 52 cells for control CMs, n = 46 cells for DMD CMs, n = 55 cells for cDMD-RF CMs, n = 52 cells for cDMD-ES CMs; quantification was performed across three independent batches of differentiation).
F) Quantification of relaxation time of single control, DMD and cDMD CMs (n = 52 cells for control CMs, n = 46 cells for DMD CMs, n = 55 cells for cDMD-RF CMs, n = 52 cells for cDMD-ES CMs; quantification was performed across three independent batches of differentiation).
Functional analyses were performed at d35 post-differentiation. Quantified data are shown as mean ± s.e.m. **p<0.01, ***p<0.001 and ****p<0.0001.

