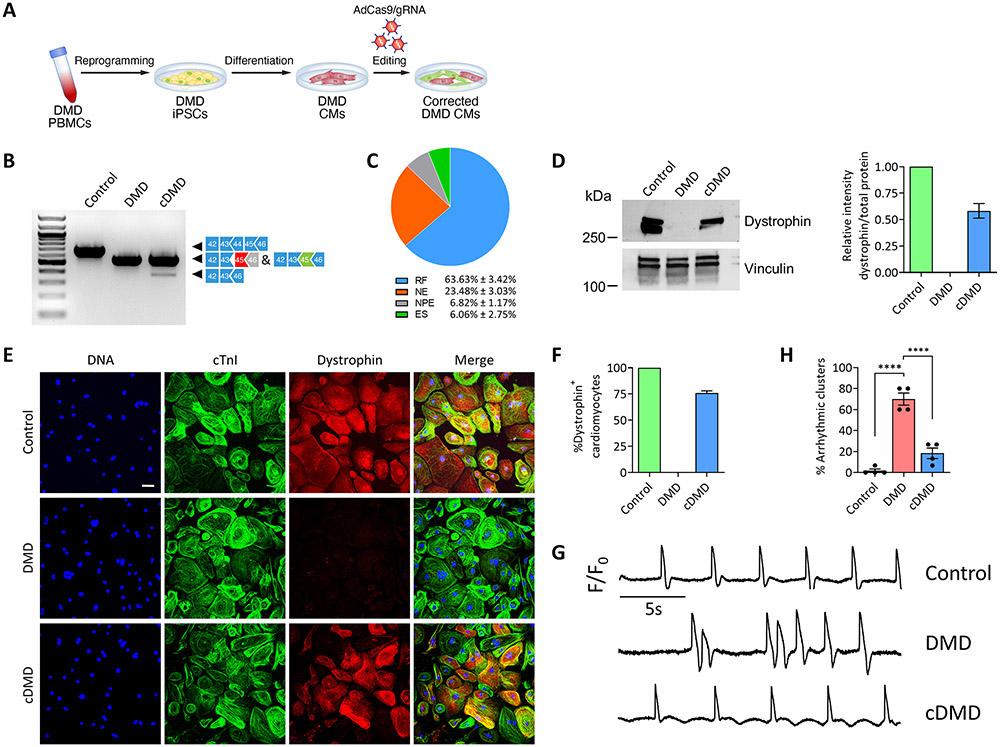
Figure 4. Postnatal dystrophin correction reduces arrhythmogenicity of iPSC-CMs.
A) Schematic showing postnatal gene editing in DMD CMs by adenoviral delivery of Cas9 and gRNA.
B) RT-PCR analysis using primers targeting exons 42 and 46 of DMD cDNA from control, DMD and cDMD CMs.
C) Pie chart showing the percentage of gene editing events in iPSC-CMs based on RT-PCR sequence analysis of TOPO-TA generated clones. RF, reframing; NE, no editing; NPE, non-productive editing; ES, exon skipping.
D) (Left) Western blot analysis of control, DMD and cDMD CMs for dystrophin and vinculin. (Right) Quantification of dystrophin expression based on Western blot analysis (n = 3 samples per group across three independent batches of differentiation). Total protein expression served as loading control (Online Fig. XA).
E) Representative immunofluorescence images of control, DMD and cDMD CMs stained for dystrophin and cardiac troponin I. Scale bar 50μm.
F) Quantification of dystrophin-positive CMs in control, DMD and cDMD CMs (n = 1,612 cells for control CMs, n = 1,569 cells for DMD CMs, n = 1,734 cells for cDMD CMs; quantification was performed across three independent batches of differentiation).
G) Representative membrane potential traces of clusters of control, DMD and cDMD CMs loaded with the voltage-sensitive probe FluoVolt.
H) Quantification of the percentage of arrhythmic clusters of control, DMD and cDMD CMs based on FluoVolt imaging (n = 60 clusters per group across four independent batches of differentiation).
iPSC CMs were transduced with adenovirus at d35 post-differentiation and functional analyses were performed at d65 post-differentiation. Quantified data are shown as mean ± s.e.m. ****p<0.0001.

