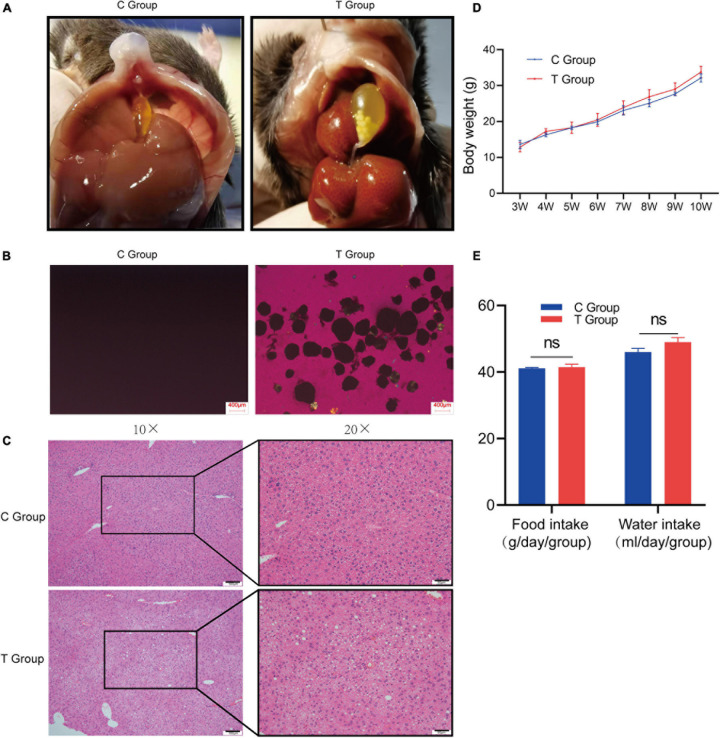
FIGURE 1.
Gallstone formation and liver pathology of C57BL/6J mice after 8 weeks of dietary intervention. (A) Macroscopic appearances of the gallbladders of T group and C group mice. (B) Polarized light microscopy of gallbladder bile of T group and C group mice. (C) Severe steatosis occurred, along with inflammatory cell infiltration and hepatocyte necrosis in the liver cells of the T group, and liver cells were well formed in the C group. (D) Changes in body weight of mice from 3 weeks of age to 10 weeks of age. The figure shows that the body weight of the two groups of mice is not statistically significant. (E) Calculate the daily food intake and water intake of the two groups of mice. The results showed that there was no statistical difference in the food intake and water intake of the two groups of mice.

