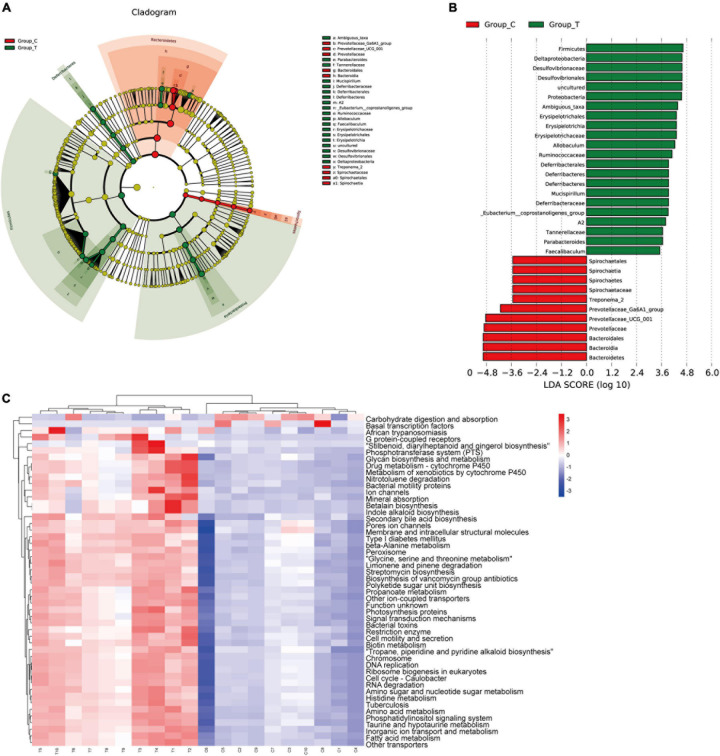
FIGURE 3.
LEfSE analysis and PICRUSt analysis results. (A) The LEfSe cladogram in green shows the taxa enriched in the T group, and that in red shows the taxa enriched in the C group. The diameter of nodes is directly proportional to the relative abundance. (B) Taxonomic cladogram obtained using linear discriminant analysis (LDA) effect size (LEfSe) analysis and Mann–Whitney U-tests of the 16S sequences. LEfSe identified the taxa with the greatest differences in abundance between the T group and C group. At the phylum, class, order, family and genus levels, the control-enriched taxa are indicated by a positive LDA score (red), and T group-enriched taxa are indicated by a negative score (green). Only taxa meeting a significant LDA threshold value of > 2 are shown. (C) PICRUSt analysis results of predicted functional pathways in the gut microbiota.

