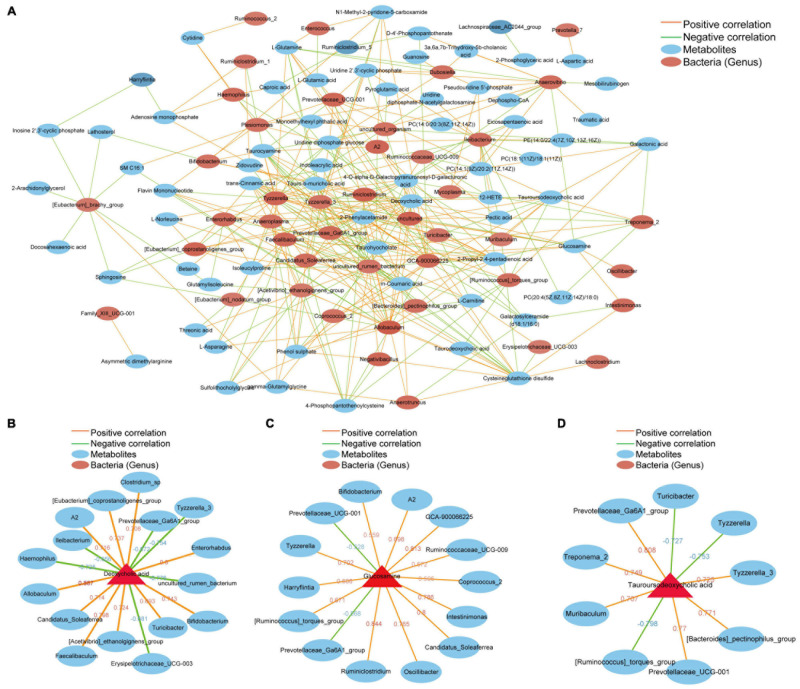
FIGURE 6.
Potential correlations between the gut microbiota and liver metabolites. The red line represents a positive correlation, and the green line represents a negative correlation. The thickness of the line represents the correlation coefficient. (A) Correlation between 52 different intestinal bacterial genera and the top 100 metabolites. (B) Bacteria that are positively or negatively related to deoxycholic acid. (C) Bacteria that are positively or negatively related to glucosamine. (D) Bacteria that are positively or negatively related to tauroursodeoxycholic acid. (Student’s t-test, p < 0.05, Spearman correlation analysis, | correlation coefficient| ≥ 0.6).

