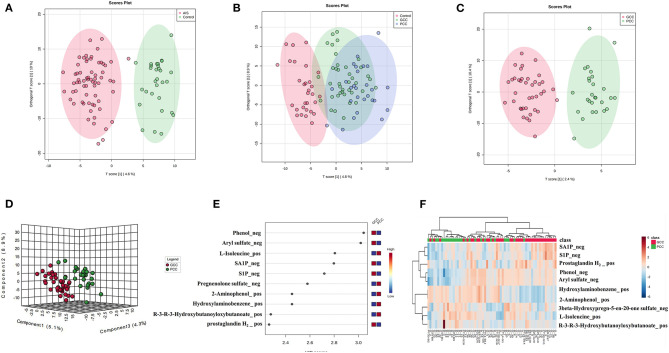
Figure 2.
Metabolic profile of patients with GCC compared with patients with PCC. (A) OPLS-DA two-dimensional plot ellipses representing 95% CIs between AIS and healthy control groups. (B) OPLS-DA two-dimensional plot ellipses representing 95% CIs among healthy control, PCC, and GCC groups. (C) OPLS-DA two-dimensional plot ellipses representing 95% CIs between PCC and GCC groups. (D) The three-dimensional PLS-DA plot showing good model discrimination between patients with GCC compared with patients with PCC. (E) The VIP plot generated from the PLS-DA analysis showing the top 10 discriminative metabolites when the GCC group compared with the PCC group. (F) The heat map of the top 10 differentially accumulated metabolites when GCC group compared with PCC group. AIS, acute ischemic stroke; GCC, good collateral circulation; PCC, poor collateral circulation; OPLS-DA, orthogonal partial least squares discriminant analysis; PLS-DA, partial least squares discriminant analysis; VIP, variable importance in projection.

