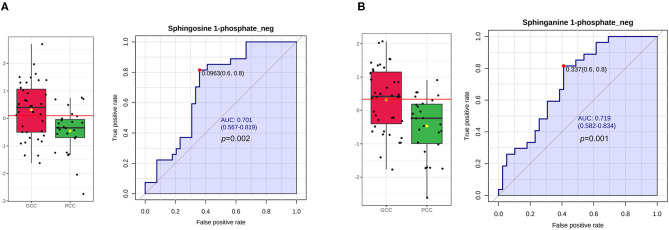
Figure 4.
S1P and SA1P levels in GCC and PCC groups and ROC analysis in the discovery stage. (A) Plasma S1P_neg levels were statistically significant between GCC and PCC groups and the ROC analysis of S1P_neg in differentiating GCC and PCC groups. (B) Plasma SA1P_neg levels were statistically significant between GCC and PCC groups and the ROC analysis of SA1P_neg in differentiating GCC and PCC groups. GCC, good collateral circulation; PCC, poor collateral circulation; ROC, receiver operating characteristic curve; AUC, area under the curve; S1P_neg, sphingosine-1-phosphate in negative ion mode; SA1P_neg, sphinganine-1-phosphate in negative ion mode.

