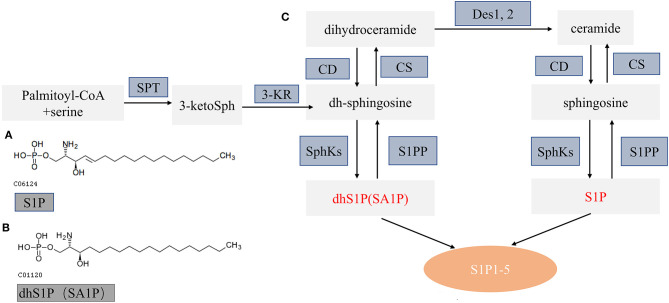
Figure 7.
Schematic diagram of sphingolipid metabolism. (A,B) The molecular structure of S1P and SA1P. (C) Model of sphingolipid metabolism: this schematic model depicts the de novo pathway of sphingolipid metabolism. S1PP, sphingosine 1-phosphate phosphatase; SphKs, sphingosine kinases; S1P 1–5, S1P receptors 1–5; SPT, serine palmitoyl transferase; KR, ketosphingosine reductase; CS, ceramide synthase; CD, ceramidase; S1P, sphingosine 1-phosphate; dhS1P, dihydrosphingosine 1-phosphate; DES, dihydroceramide desaturase. Altered metabolites in this study are in red font.

