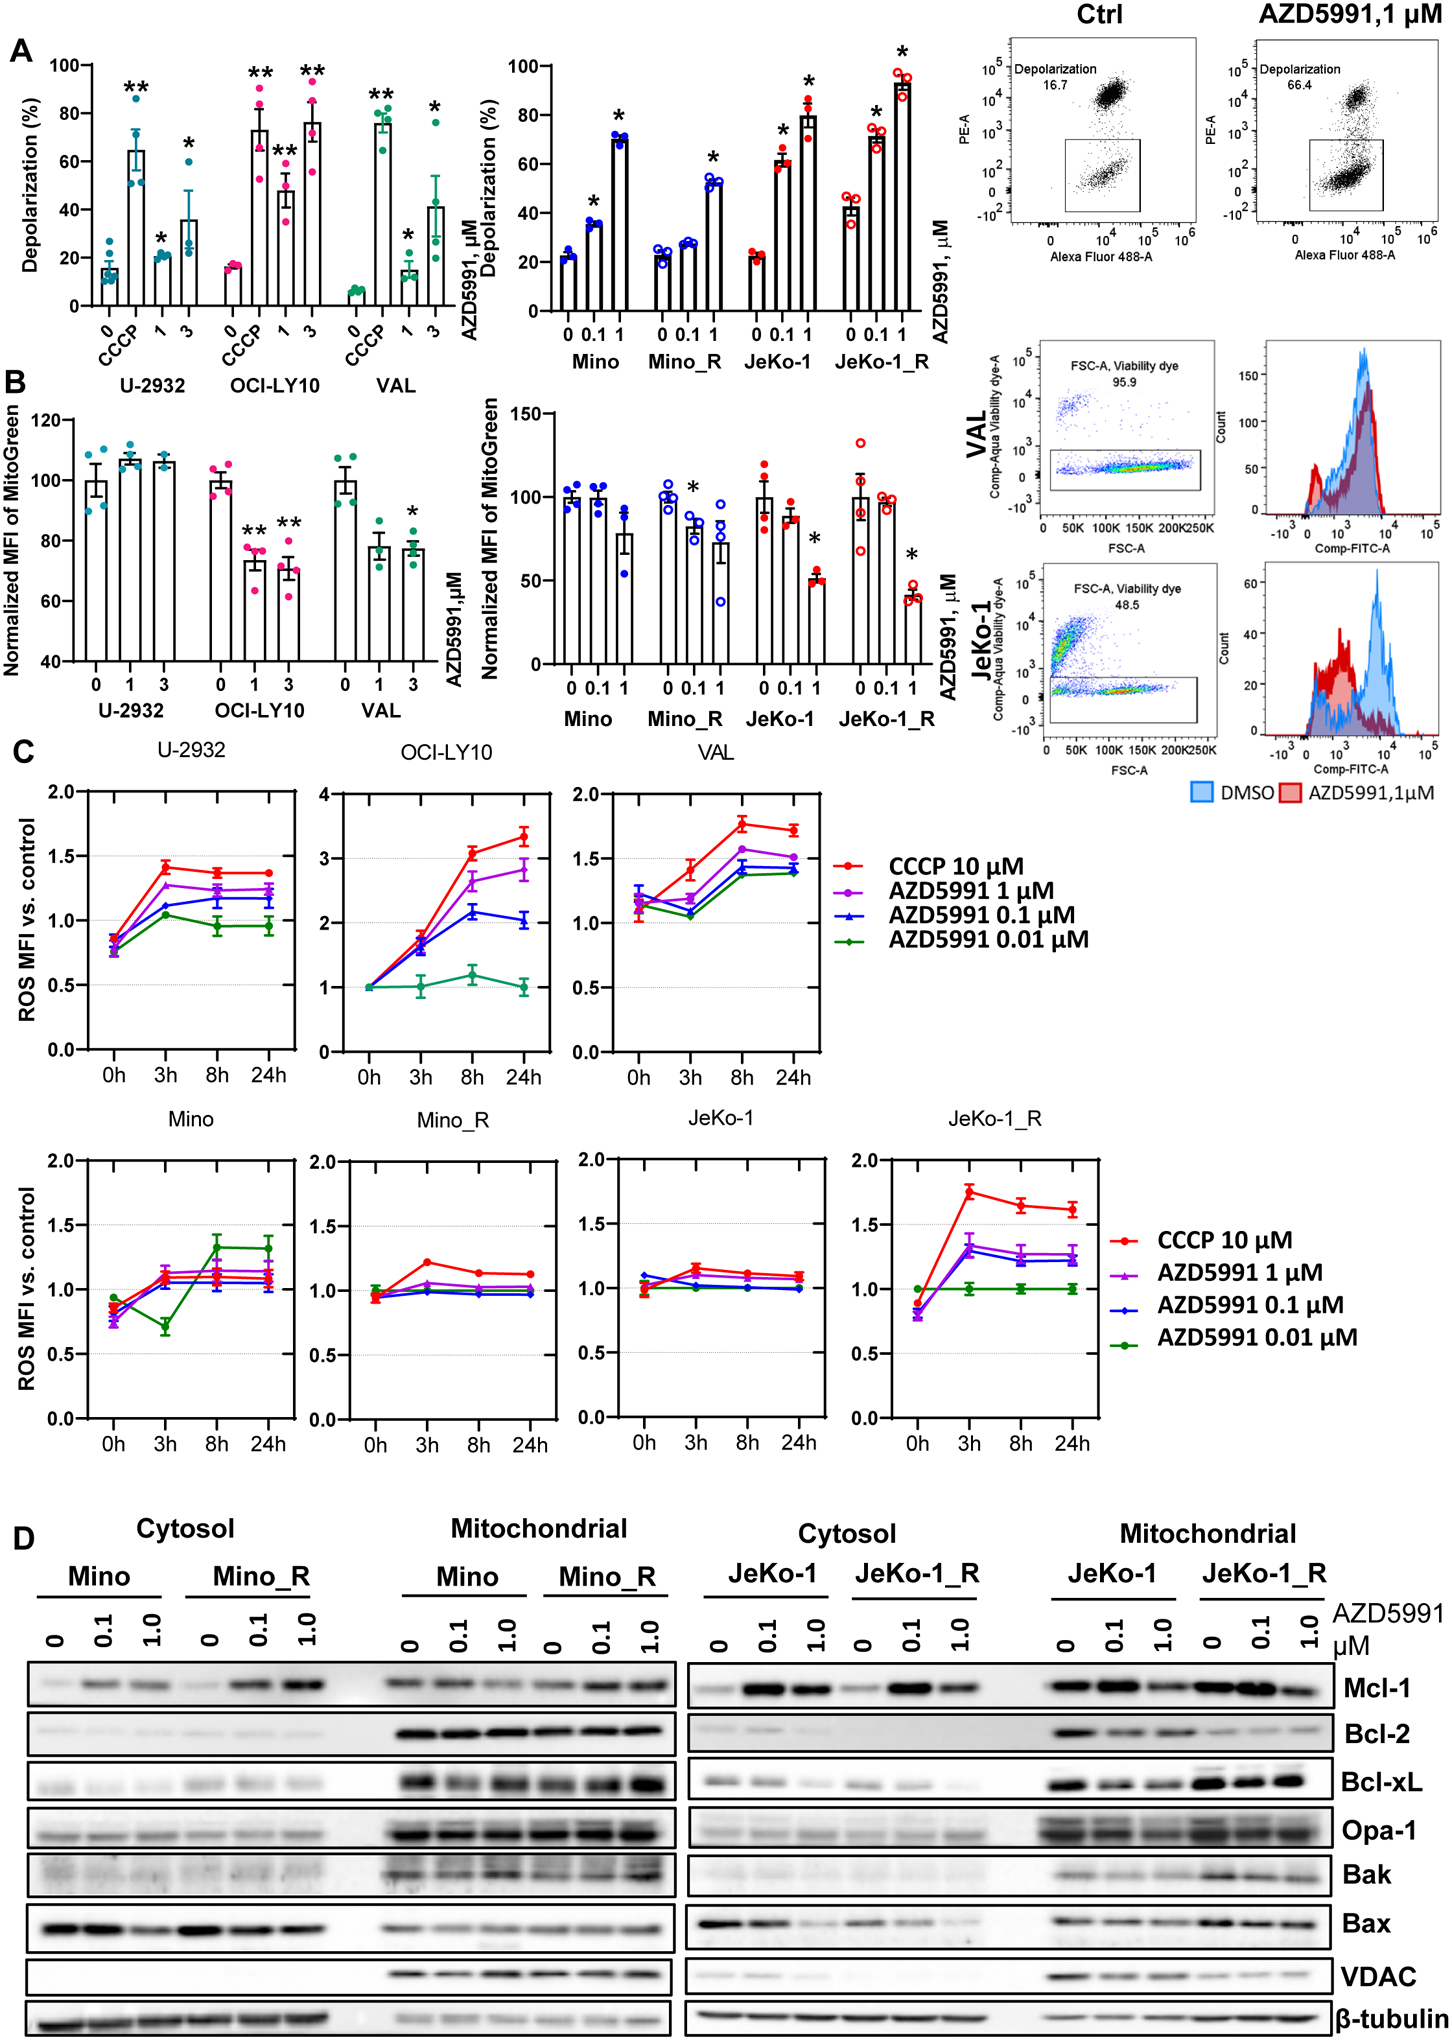
Figure 2. Mcl-1 inhibition leads to mitochondrial dysfunction.

(A) Cells (in technical and biological triplicates) were treated with 10 μM CCCP, 0.1, 1 or 3 μM AZD5991 or vehicle control for 24 hours and analyzed for mitochondrial depolarization with JC-1 dye using flow cytometry. A representative dot plot image is shown (depolarized mitochondria is boxed). (B) Cell lines were treated with drugs for 24 hours as indicated and mitochondrial mass was assessed with Mitobright Green using flow cytometry. A representative histogram is shown. Data are mean±SE. *, p<0.05, **, p<0.01 vs. untreated control. (C) Cells were stained with DCFDA, treated with drugs for 24 h, followed by ROS MFI quantification at the indicated timepoints. MFI was normalized to untreated control. (D) Cells were treated with indicated doses of AZD5991 for 8 h followed by cellular fractionation and immunoblotting.
