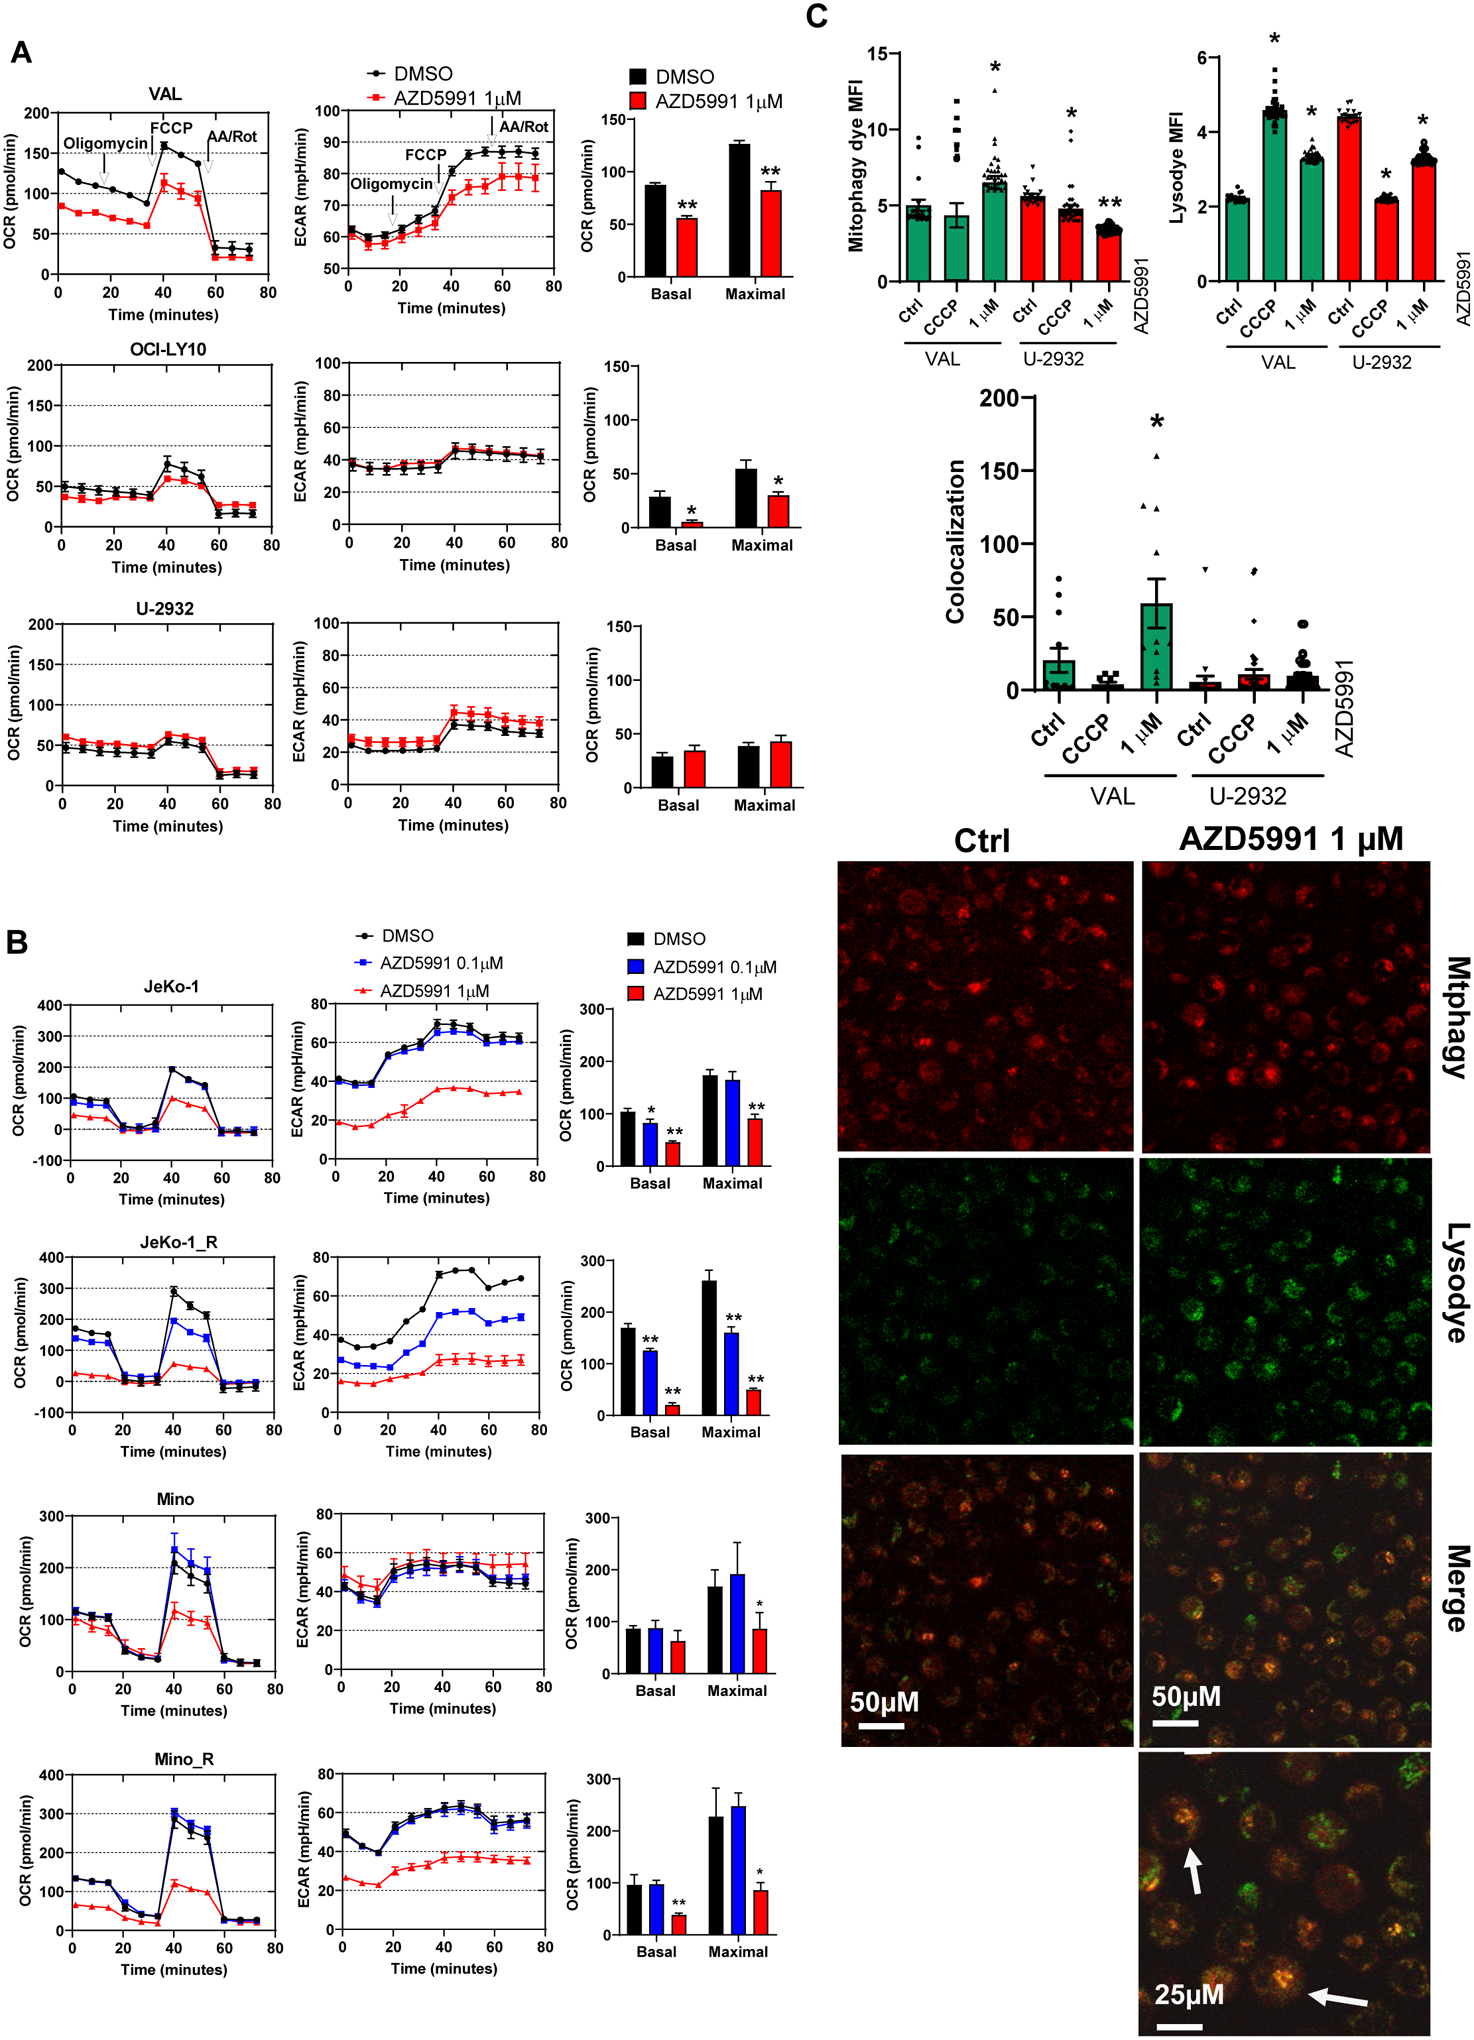
Figure 3. Mcl-1 inhibition deregulates OxPhos and induces mitophagy.

(A, B) Cells were treated with 1 μM AZD5991 or control for 24 h and subjected to Seahorse analysis. Oxygen consumption rate (OCR) and extracellular acidification rate (ECAR) as a function of time, with exposure to inhibitors of the electron transport chain (ETC) and oxidative phosphorylation (OxPhos) to derive bioenergetics parameters of mitochondrial respiration are shown. (C) VAL (sensitive) and U-2932 (resistant) cells were treated with 1 μM AZD5991 or vehicle control for 24 h and stained with Mitophagy dye and Lysodye. Live cells were imaged with confocal microscopy. Arrows point to the mitophagy puncta. MFI was quantified, and co-localization was measured and calculated using Zen software. Data are mean±SE. A representative image (VAL cells) is shown. *, p<0.05 vs. untreated control.
