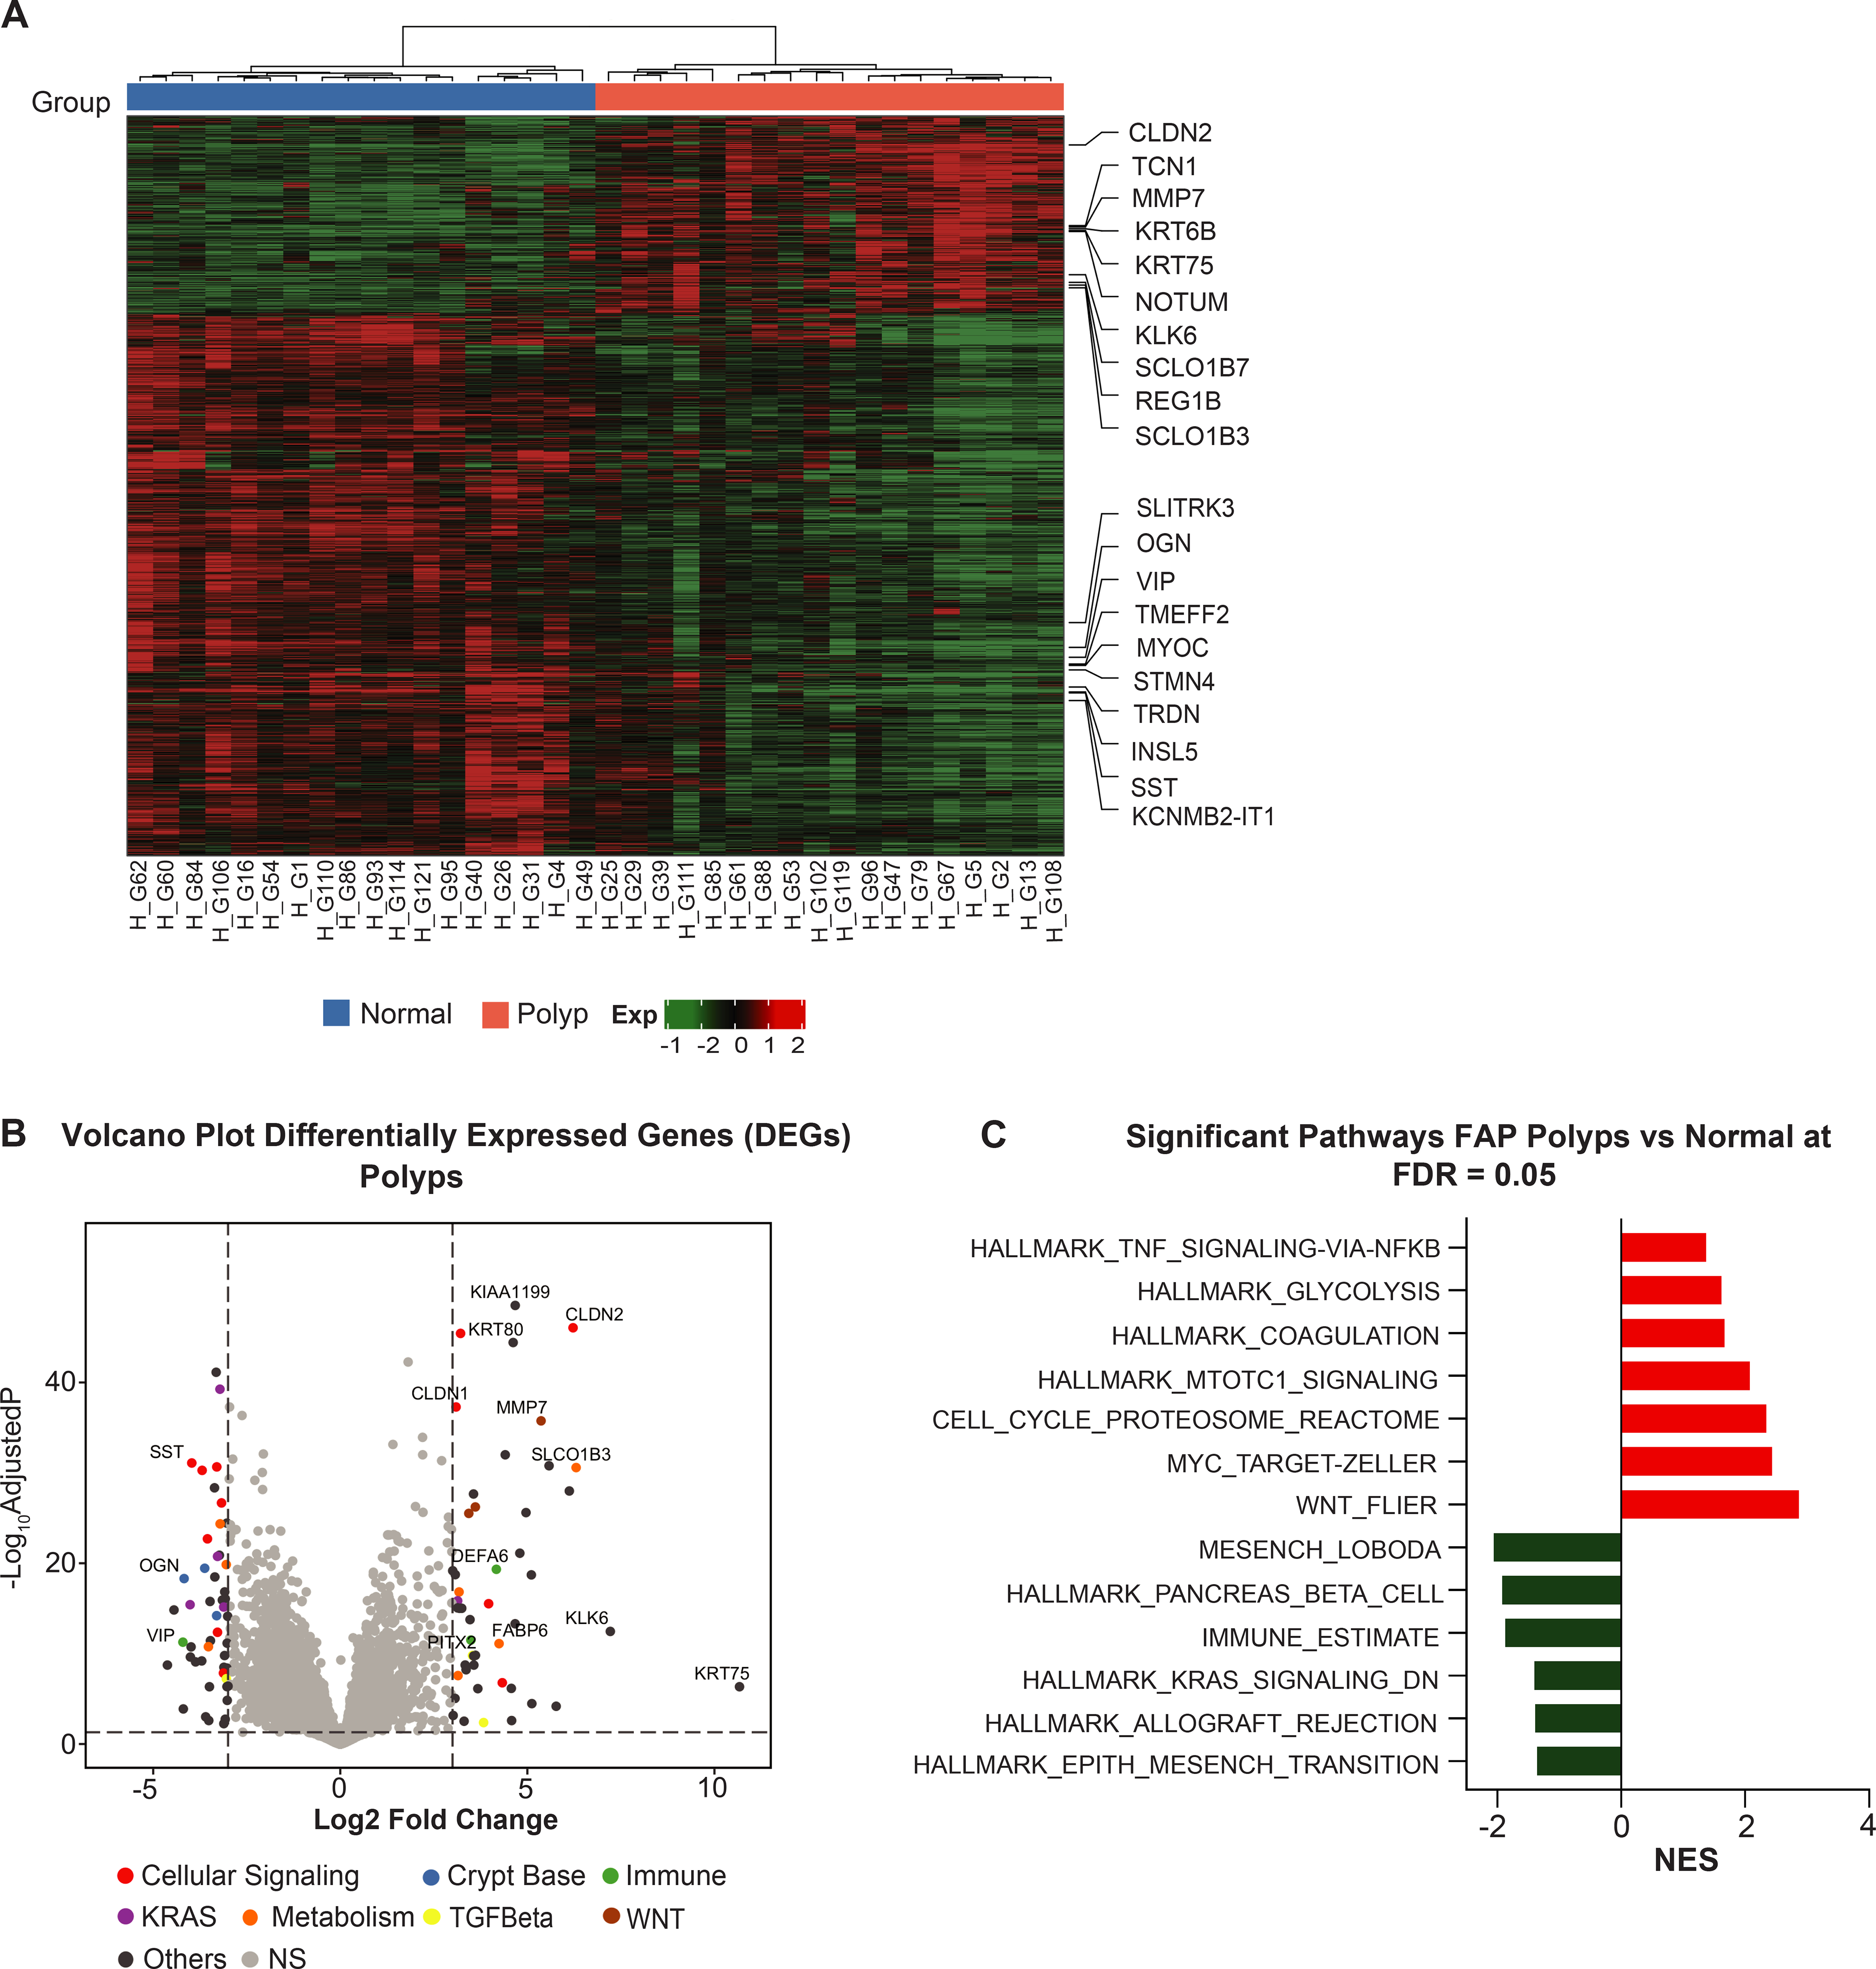
Figure 1. Gene expression analysis of human FAP using paired samples.

(A) Significant differentially expressed genes (DEGs) with adjusted P-value ≤0.05 and absolute value of log2-FoldChange ±1 in human normal colorectal mucosa and polyp were used to perform a paired hierarchical clustering. The top ten upregulated and downregulated genes are presented as column names and sample IDs as row names. The column covariate bar indicates polyps (red) and normal colorectal mucosa (blue) that samples belong to. Dendrogram illustrates sample clustering based on distances; (B) Genes from whole transcriptome sequencing are displayed in volcano plots with log2(FoldChange) on the X-axis and -log10(adjusted P-value) on the Y-axis. The significant up- and down-regulated genes with an adjusted P-value≤0.05 and an absolute value of log2-FoldChange ≥3 are highlighted and annotated in different colors within pathways of interest. The horizontal line represents BH-adjusted P-value=0.05. The left and right vertical lines represent log2-FoldChange ±3, respectively; (C) GSEA for the significant pathways with an adjusted P-value ≤0.05 in the Reactome biological and CRC pathways. The horizontal bars denote the different pathways based on the normalized enrichment score (NES). Red color indicates positive NES (positively enriched in polyps) and negative NES in green color (negatively enriched in polyps).
